February 15, 2026 a 07:31 am


ARE: Dividend Analysis - Alexandria Real Estate Equities, Inc.
Alexandria Real Estate Equities, Inc. presents a compelling case for dividend investors with a robust dividend yield of 9.56%. However, the negative payout ratios and declining dividend growth highlight areas of concern. This analysis delves into the key metrics and financial performance to provide a comprehensive evaluation of the company's dividend health.
📊 Overview
The overview of Alexandria's real estate investment trust structure provides insights into its sector and dividend distribution strategy.
| Metric | Value |
|---|---|
| Sector | Real Estate |
| Dividend yield | 9.56% |
| Current dividend per share | 5.35 USD |
| Dividend history | 29 years |
| Last cut or suspension | 2025 |
📈 Dividend History
The long-standing dividend history indicates a commitment to shareholder returns. The recent cut in 2025 deserves attention as it implies potential yield risk.
| Year | Dividend per Share |
|---|---|
| 2025 | $4.68 |
| 2024 | $5.19 |
| 2023 | $4.96 |
| 2022 | $4.72 |
| 2021 | $4.48 |
📊 Dividend Growth
Understanding dividend growth over time is crucial for forecasting future income potential. Alexandria has seen slight fluctuations over recent years.
| Time | Growth |
|---|---|
| 3 years | -0.28% |
| 5 years | 1.99% |
The average dividend growth is 1.99% over 5 years. This shows moderate but steady dividend growth.
📊 Payout Ratio
The payout ratio reveals the sustainability of dividends relative to company earnings or cash flow.
| Key figure ratio | Value |
|---|---|
| EPS-based | -63.71% |
| Free cash flow-based | 65.56% |
The negative EPS payout ratio indicates financial stress affecting earnings, while the FCF ratio is more manageable but highlights potential growth constraints.
Cashflow & Capital Efficiency
Cash flow analysis allows us to assess the company's ability to sustain dividends and invest in growth opportunities.
This section provides a comprehensive view of the financial efficiency of Alexandria, based on various key indicators.
| Metric | 2025 | 2024 | 2023 |
|---|---|---|---|
| Free Cash Flow Yield | 16.96% | 8.96% | 7.53% |
| Earnings Yield | -17.15% | 1.92% | 0.48% |
| Free Cash Flow / Operating Cash Flow Ratio | 100% | 100% | 100% |
The robust free cash flow yield indicates potential future performance improvements, yet negative earnings yield requires immediate attention to sustainability.
Balance Sheet & Leverage Analysis
Analyzing balance sheet metrics gives insight into the company's leverage and financial stability.
| Metric | 2025 | 2024 | 2023 |
|---|---|---|---|
| Debt-to-Equity | 0.82 | 0.71 | 0.63 |
| Debt-to-Assets | 0.37 | 0.34 | 0.32 |
| Net Debt to EBITDA | 33.88 | 6.42 | 7.65 |
| Current Ratio | 0.43 | — | — |
The stable leverage ratios suggest careful debt management, yet the extreme Net Debt to EBITDA ratio suggests potential liquidity issues that need addressing.
Fundamental Strength & Profitability
The fundamentals reflect the core business performance and efficiency in generating returns on investments.
| Metric | 2025 | 2024 | 2023 |
|---|---|---|---|
| Return on Equity | -9.25% | 1.80% | 0.56% |
| Net Margin | -48.15% | 10.59% | 3.65% |
The negative metrics indicate challenges in profitability, which necessitates strategic initiatives to curb costs and enhance revenue streams.
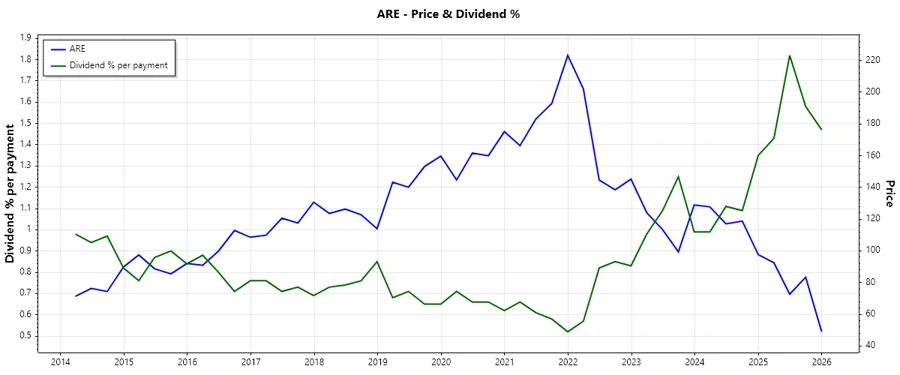
📈 Price Development
🔍 Dividend Scoring System
| Category | Score | Scale |
|---|---|---|
| Dividend yield | 5 | |
| Dividend Stability | 2 | |
| Dividend growth | 2 | |
| Payout ratio | 3 | |
| Financial stability | 3 | |
| Dividend continuity | 4 | |
| Cashflow Coverage | 5 | |
| Balance Sheet Quality | 2 |
Overall Score: 26/40
🗣️ Rating
While Alexandria Real Estate Equities, Inc. offers a high yield for dividend investors, its financial metrics signal caution. The current analysis recommends a balanced approach with close monitoring of financial health and payout sustainability.
Smart Data Insight
Master the Perfect Entry & Exit for this Stock
Don't leave your profits to chance. Historically, this stock follows specific seasonal patterns that institutional traders use to maximize returns.
- ✅ Identify the "Golden Buying Window"
- ✅ Avoid high-risk correction cycles
- ✅ Backtested data from the last 20+ years