October 08, 2025 a 02:47 am
ARE: Dividend Analysis - Alexandria Real Estate Equities, Inc.
Alexandria Real Estate Equities, Inc. exhibits a strong dividend profile with a commendable track record. With a current dividend yield of over 6%, it provides an attractive income stream for investors. The company’s steadfast dividend history and cautious approach to managing dividend payments make it appealing to income-centric portfolios.
Overview 📊
Analyzing the fundamental financial data is crucial for understanding the capacity of Alexandria Real Estate Equities, Inc. to maintain and potentially increase its dividend payments.
| Key Metric | Value |
|---|---|
| Sector | Real Estate |
| Dividend yield | 6.34 % |
| Current dividend per share | 5.22 USD |
| Dividend history | 29 years |
| Last cut or suspension | None |
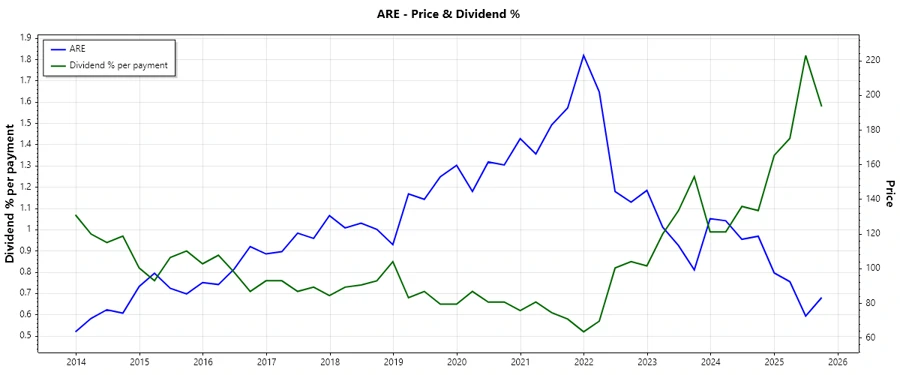
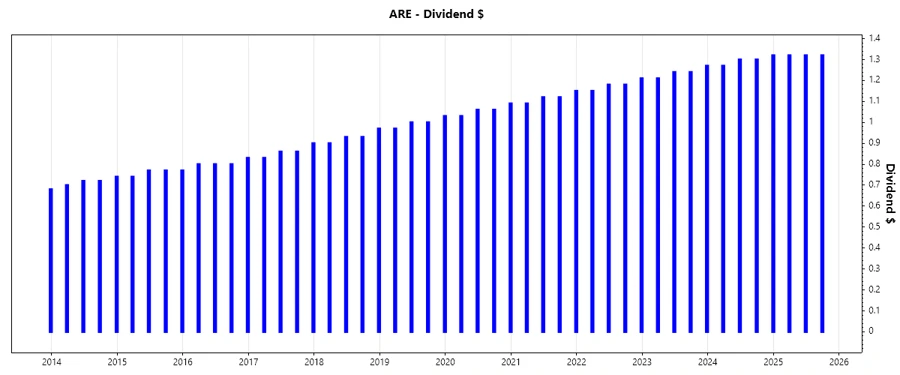
Dividend History 🗣️
The historical analysis of dividends aids in understanding the company's commitment to returning value to its shareholders. Consistency in dividend payouts over decades signals company stability.
| Year | Dividend Per Share (USD) |
|---|---|
| 2025 | 3.96 |
| 2024 | 5.19 |
| 2023 | 4.96 |
| 2022 | 4.72 |
| 2021 | 4.48 |
Dividend Growth 📈
The dividend growth rate is vital to anticipate future income from the stock and align with investment goals.
| Time | Growth |
|---|---|
| 3 years | 5.03 % |
| 5 years | 5.35 % |
The average dividend growth is 5.35 % over 5 years. This shows moderate but steady dividend growth.
Payout Ratio ✅
Assessing the payout ratios provides insights into the sustainability of the dividend payments relative to the company’s earnings and cash flows.
| Key figure | Ratio |
|---|---|
| EPS-based | -6915.06 % |
| Free cash flow-based | 63.61 % |
The negative EPS payout ratio indicates earnings deficits, while the FCF payout ratio suggests that dividends are covered through cash flows. This discrepancy warrants closer investigation.
Cashflow & Capital Efficiency 💵
Cash flow stability and efficient capital utilization are critical when evaluating the company's ability to sustain long-term dividend payments.
| Year | 2024 | 2023 | 2022 |
|---|---|---|---|
| Free Cash Flow Yield | 8.96% | 7.53% | 5.50% |
| Earnings Yield | 1.92% | 0.48% | 2.22% |
| CAPEX to Operating Cash Flow | 0% | 0% | 0% |
| Stock-based Compensation to Revenue | 1.96% | 2.92% | 2.23% |
| Free Cash Flow / Operating Cash Flow Ratio | 1 | 1 | 1 |
The stability of cash flows over the years indicates robust operational execution, facilitating continued dividend distributions.
Balance Sheet & Leverage Analysis 📊
Financial stability and a well-structured balance sheet safeguard against potential risks and highlight liquidity strength.
| Year | 2024 | 2023 | 2022 |
|---|---|---|---|
| Debt-to-Equity | 0.71 | 0.63 | 0.56 |
| Debt-to-Assets | 0.34 | 0.32 | 0.30 |
| Debt-to-Capital | 0.42 | 0.39 | 0.36 |
| Net Debt to EBITDA | 6.42 | 7.65 | 5.98 |
| Current Ratio | 0.40 | 0.39 | 0.58 |
| Quick Ratio | 0.40 | 0.39 | 0.58 |
The company maintains a conservative leverage, suggesting a prudent approach to balancing debt with equity, which enhances durability against credit stresses.
Fundamental Strength & Profitability 📈
Measuring key profitability metrics offers valuable insights into the operational efficacy and overall profitability of the company.
| Year | 2024 | 2023 | 2022 |
|---|---|---|---|
| Return on Equity | 1.81% | 0.56% | 2.75% |
| Return on Assets | 0.86% | 0.28% | 1.47% |
| Margins (Net) | 10.59% | 3.65% | 20.15% |
| Margins (EBIT) | 22.84% | 12.50% | 29.54% |
| Research & Development to Revenue | 0% | 0% | 0% |
Though operational performance exhibits volatility, the company’s margins and returns demonstrate an ability to navigate competitive pressures effectively.
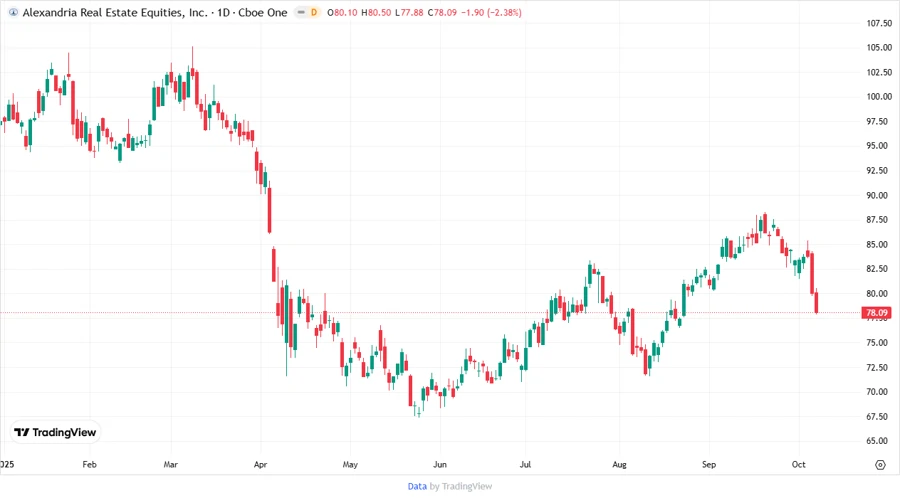
Price Development 📉
Dividend Scoring System 🏆
| Criteria | Score | Score Bar |
|---|---|---|
| Dividend yield | 5 | |
| Dividend Stability | 4 | |
| Dividend Growth | 3 | |
| Payout ratio | 2 | |
| Financial stability | 4 | |
| Dividend continuity | 5 | |
| Cashflow Coverage | 4 | |
| Balance Sheet Quality | 3 |
Total Score: 30/40
Rating ⭐
Alexandria Real Estate Equities, Inc. presents a robust dividend yield with a consistent history of payouts, making it a viable candidate for income-focused investors. Caution is advised due to the high payout ratio relative to earnings, yet the solid cash flow coverage and financial stability mitigate some risk factors.
Smart Data Insight
Master the Perfect Entry & Exit for this Stock
Don't leave your profits to chance. Historically, this stock follows specific seasonal patterns that institutional traders use to maximize returns.
- ✅ Identify the "Golden Buying Window"
- ✅ Avoid high-risk correction cycles
- ✅ Backtested data from the last 20+ years