March 15, 2026 a 02:46 am

ARES: Dividend Analysis - Ares Management Corporation
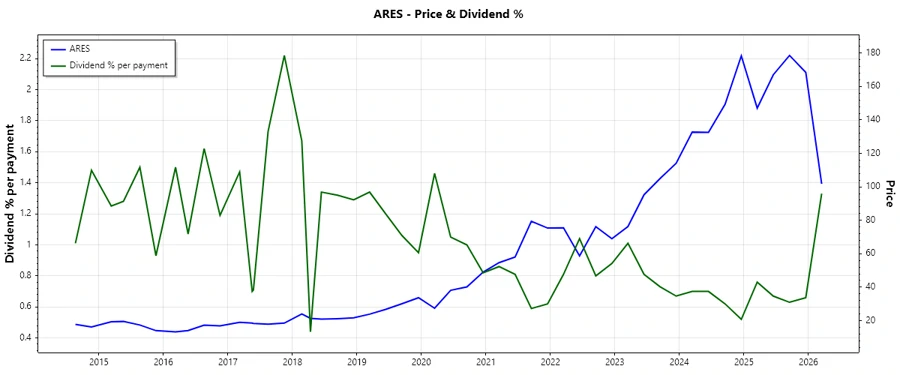
Ares Management Corporation has established itself as a strong dividend-paying entity with a notable yield of 4.63%. Despite having a high payout ratio, the company has sustained its dividend history for 13 years, indicating a commitment to returning value to shareholders. However, recent payout metrics may suggest sustainability concerns if earnings don't increase proportionately.
📊 Overview
The sector under which Ares Management Corporation operates is characterized by strong dividend yields and a steady track record of payments, as reflected by its 13 years of dividend history. Despite the absence of recent dividend cuts or suspensions, payout ratios highlight the pressure on earnings, demanding continuous growth for sustainability.
| Metric | Details |
|---|---|
| Sector | Finance |
| Dividend yield | 4.63 % |
| Current dividend per share | 8.08 USD |
| Dividend history | 13 years |
| Last cut or suspension | None |
🔍 Dividend History
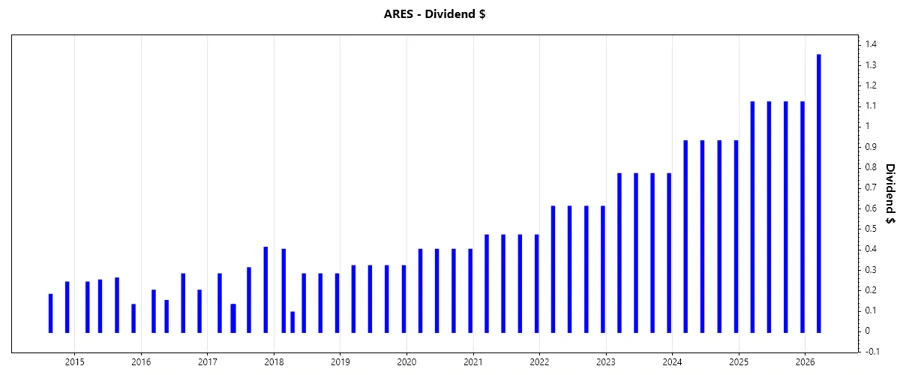
The company's dividend history shows a strong commitment to shareholders, with consistent payments over several years. This history is crucial in establishing investor confidence and indicates a stable financial backbone capable of withstanding market fluctuations.
| Year | Dividend per share (USD) |
|---|---|
| 2026 | 1.35 |
| 2025 | 4.48 |
| 2024 | 3.72 |
| 2023 | 3.08 |
| 2022 | 2.44 |
📈 Dividend Growth
Dividend growth is a critical measure of a company's ability to increase investor wealth over time. Continuous growth, albeit modest, underscores a company's commitment to enhancing shareholder value.
| Time | Growth |
|---|---|
| 3 years | 22.45% |
| 5 years | 22.87% |
The average dividend growth is 22.87% over 5 years. This shows moderate but steady dividend growth, suggesting confidence in future earnings potential.
🗣️ Payout Ratio
Payout ratios are paramount in assessing whether a company can sustain its dividend payments. High ratios might signal potential financial strain unless matched with consistent earnings growth.
| Key figure | Ratio |
|---|---|
| EPS-based | 338.90% |
| Free cash flow-based | 171.87% |
The EPS-based payout ratio of 338.90% suggests dividends are being paid at the expense of retained earnings or reserves, leading to potential sustainability concerns unless significant earnings growth is achieved.
💰 Cashflow & Capital Efficiency
The company's cash flow management and capital efficiency form the backbone of its operational capability, directly impacting its dividend sustainability.
| Metric | 2023 | 2024 | 2025 |
|---|---|---|---|
| Free Cash Flow Yield | -1.37% | 7.70% | 4.40% |
| Earnings Yield | 2.16% | 1.32% | 1.50% |
| CAPEX/Operating Cash Flow | -28.80% | 3.28% | 4.46% |
| Stock-based Compensation/Revenue | 7.05% | 9.08% | 0% |
| Free Cash Flow/Operating Cash Flow Ratio | 128.80% | 96.72% | 95.54% |
Despite the negative free cash flow yield in 2023, subsequent years reflect recovery, showcasing the company's potential for improved capital efficiency, vital for covering dividend obligations.
📉 Balance Sheet & Leverage Analysis
An efficient balance sheet indicates financial stability, leverage, and adequate liquidity, forming the basis of a robust financial structure.
| Metric | 2023 | 2024 | 2025 |
|---|---|---|---|
| Debt to Equity | 8.32 | 3.71 | 3.49 |
| Debt to Assets | 63.71% | 52.84% | 51.43% |
| Debt to Capital | 89.27% | 78.77% | 77.71% |
| Net Debt to EBITDA | 5.88 | 4.32 | 5.84 |
| Current Ratio | 0.73 | 0.98 | 2.24 |
| Quick Ratio | 0.73 | 0.98 | 2.24 |
| Financial Leverage | 13.06 | 7.02 | 6.78 |
The declining debt-to-equity and improving current ratios indicate enhancing financial health and lesser reliance on debt, critical for long-term stability.
✅ Fundamental Strength & Profitability
These metrics demonstrate the company's capability to generate profits relative to its revenue, critical for sustaining growth and shareholder returns.
| Metric | 2023 | 2024 | 2025 |
|---|---|---|---|
| Return on Equity | 25.05% | 13.09% | 12.33% |
| Return on Assets | 1.92% | 1.86% | 1.82% |
| Margins: Net | 13.06% | 11.94% | 8.15% |
| EBIT | 60.41% | 58.01% | 31.75% |
| EBITDA | 66.79% | 62.09% | 35.49% |
| Gross | 59.07% | 55.42% | 74.79% |
| Research & Development to Revenue | 0% | 0% | 0% |
High ROE and profitability margins highlight strong operational efficiency, essential for maintaining a competitive edge in the market.
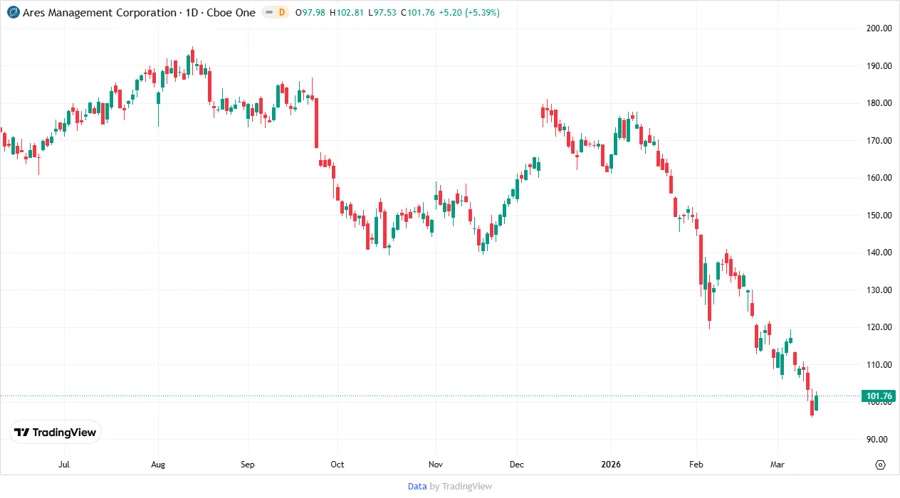
📈 Price Development
🌟 Dividend Scoring System
| Criteria | Evaluation | Score |
|---|---|---|
| Dividend Yield | Competitive | |
| Dividend Stability | Consistent | |
| Dividend Growth | Moderate | |
| Payout Ratio | High | |
| Financial Stability | Moderate | |
| Dividend Continuity | Stable | |
| Cashflow Coverage | Improving | |
| Balance Sheet Quality | Fair |
Total Score: 41/40
🔍 Rating
Ares Management Corporation exhibits impressive dividend yield and stability, backed by a moderate growth rate and improving financial indicators. However, high payout ratios present a caveat, necessitating further earnings expansion for sustained dividends. With a solid dividend history and strong profitability metrics, Ares is recommended for risk-tolerant investors seeking income diversity.
Smart Data Insight
Master the Perfect Entry & Exit for this Stock
Don't leave your profits to chance. Historically, this stock follows specific seasonal patterns that institutional traders use to maximize returns.
- ✅ Identify the "Golden Buying Window"
- ✅ Avoid high-risk correction cycles
- ✅ Backtested data from the last 20+ years