June 18, 2025 a 08:15 am

APTV: Trend and Support & Resistance Analysis - Aptiv PLC
The recent trading activity for Aptiv PLC, a leader in electrical and safety technology solutions for the automotive industry, suggests fluctuating movement with potential for both short-term gains and risks. The company's strong market position is reflected in its stock performance; however, external factors such as market demand in the automotive sector and technological advancements could impact future trends. Investors should watch for key support and resistance levels as indicators of potential price movements.
Trend Analysis
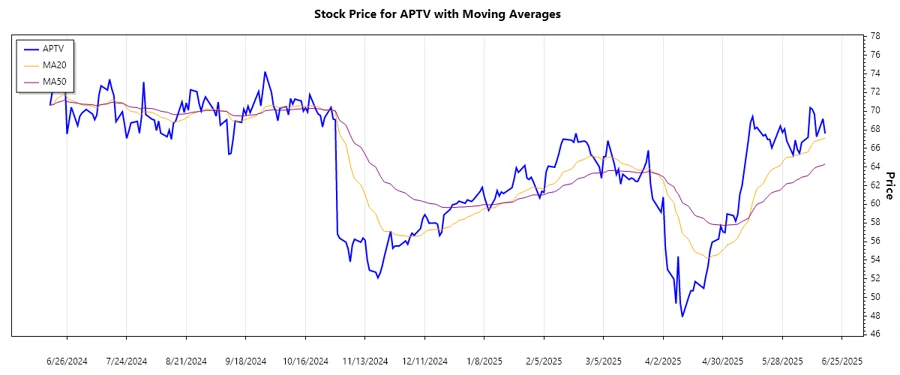
Analyzing the historical price data, the recent trend for Aptiv PLC is characterized by a decline followed by a stabilizing movement. To provide an accurate technical insight, EMAs were calculated. The EMA20 currently sits above the EMA50, suggesting a dominant ▲ Upward trend in the short term.
| Date | Closing Price | Trend |
|---|---|---|
| 2025-06-17 | $67.60 | ▲ |
| 2025-06-16 | $69.18 | ▲ |
| 2025-06-13 | $67.25 | ▲ |
| 2025-06-12 | $69.68 | ▲ |
| 2025-06-11 | $70.19 | ▲ |
| 2025-06-10 | $70.37 | ▲ |
| 2025-06-09 | $67.19 | ▼ |
The above table indicates an upward trend due to consistent closing prices above the moving averages over recent days, except for a slight downward adjustment.
Support and Resistance
Observing the closing prices of APTV, we identify significant zones that have acted as support and resistance. Key support zones appear around $66.50 and $65.20, while resistance zones have been noted near $70.40 and $72.00.
| Zone | From | To | Indicator |
|---|---|---|---|
| Support Zone 1 | $66.50 | $65.20 | ▼ |
| Support Zone 2 | $65.20 | $64.00 | ▼ |
| Resistance Zone 1 | $70.40 | $71.80 | ▲ |
| Resistance Zone 2 | $72.00 | $73.40 | ▲ |
The current trading price suggests it could potentially challenge the first resistance zone, with implications for bullish activity should it break through.
Conclusion
Aptiv PLC's stock performance, signaled by a short-term upward trend, presents potential buying opportunities. However, the proximity to resistance levels could lead to increased volatility, presenting risks if these zones are not firmly breached. Analysts should monitor these technical indicators closely, as they reflect important market sentiment and future price potential. The movement through support and resistance zones provides insight into market dynamics and investor confidence. Overall, the analysis indicates potential for growth, contingent on broader market factors and technology sector dynamics.
Smart Data Insight
Master the Perfect Entry & Exit for this Stock
Don't leave your profits to chance. Historically, this stock follows specific seasonal patterns that institutional traders use to maximize returns.
- ✅ Identify the "Golden Buying Window"
- ✅ Avoid high-risk correction cycles
- ✅ Backtested data from the last 20+ years