April 06, 2026 a 03:15 pm
APTV: Fibonacci Analysis - Aptiv PLC
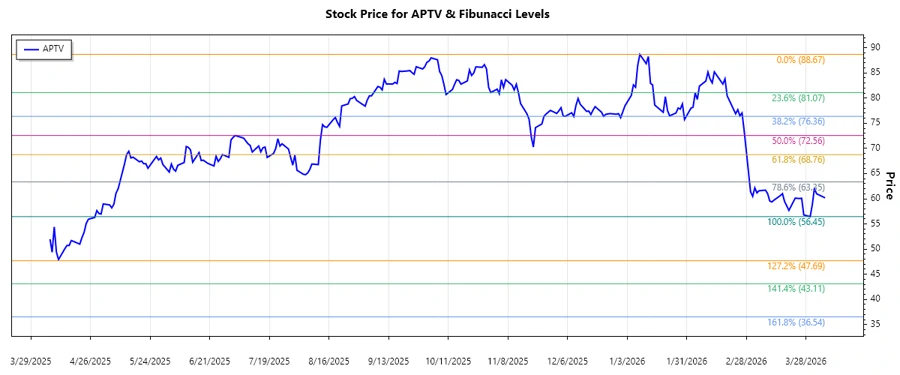
The recent trend for Aptiv PLC (APTV) indicates a predominant downward movement. Despite some fluctuations, the overall trajectory has been negative, suggesting that investors should exercise caution. This could be an opportunity for those looking for a potential entry point if the stock demonstrates signs of recovery.
Fibonacci Analysis
| Trend Analysis | Details |
|---|---|
| Start Date | 2025-11-12 |
| End Date | 2026-04-06 |
| High Price & Date | $88.67 (2026-01-09) |
| Low Price & Date | $56.45 (2026-03-30) |
| Fibonacci Level | Price Level |
|---|---|
| 0.236 | $64.80 |
| 0.382 | $68.45 |
| 0.5 | $72.56 |
| 0.618 | $76.67 |
| 0.786 | $81.53 |
The current price is around $60.18, which places it outside the primary Fibonacci retracement zones, suggesting limited retracement support currently.
Technically, this lack of retracement reinforcement suggests a continued need for vigilance, as the stock may find support lower or potentially dip further until a reversal is indicated.
Conclusion
The Aptiv PLC stock has experienced a definitive downtrend, marking a significant price correction from previous highs. For analysts, the focus should remain on upcoming earnings and macroeconomic indicators that could influence stock recovery. The potential for a reversal exists, but given the current analysis, risks from further declines persist. Patience and watching out for confirmed support levels are advised for potential investors. Buyers should exercise due diligence, while sellers might look for bounce-back opportunities to reduce losses or optimize portfolio adjustments.