October 04, 2025 a 04:45 pm
APTV: Fibonacci Analysis - Aptiv PLC
Aptiv PLC, a global leader in vehicle component manufacturing, has shown a robust performance recently. The stock has recently been in a consistent uptrend, indicating strong investor confidence in its innovative technology solutions. With its focus on advanced safety, signal, and power solutions for vehicles, Aptiv is well-positioned in the automotive market. Recent historical data suggests that the stock price has been increasing significantly, making it a focal point for technical analysis and potential investment opportunities.
Fibonacci Analysis
| Metric | Details |
|---|---|
| Start Date | 2025-04-11 |
| End Date | 2025-10-03 |
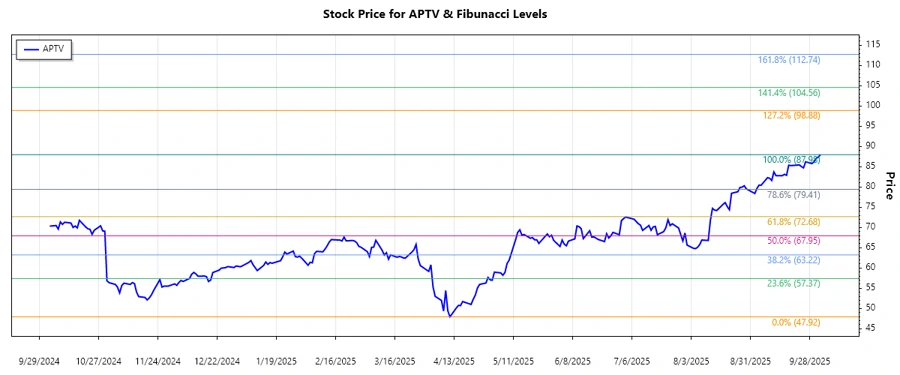
| High Price | $87.98 (2025-10-03) |
| Low Price | $47.92 (2025-04-11) |
| Fibonacci Levels |
|
| Current Price | $87.98 |
| Retracement Zone | 0.618 |
| Technical Interpretation | Currently trading near the 0.618 retracement level, which often acts as significant resistance. A break above this level can signal a continuation of the uptrend, while failure to hold could suggest potential downside pressure. |
Conclusion
Aptiv PLC has demonstrated a strong upwards trend, marked by recent historical highs. The calculated Fibonacci retracement levels suggest the stock is currently within a key resistance zone, specifically the 0.618 level. For investors, this could indicate a pivotal point in defining future price direction. Bullish momentum could propel the stock above current levels, whereas any regression may test previous support levels. The company's focus on automotive technological advancements adds to the potential upside, though market volatility should not be ignored.
Smart Data Insight
Master the Perfect Entry & Exit for this Stock
Don't leave your profits to chance. Historically, this stock follows specific seasonal patterns that institutional traders use to maximize returns.
- ✅ Identify the "Golden Buying Window"
- ✅ Avoid high-risk correction cycles
- ✅ Backtested data from the last 20+ years