August 18, 2025 a 06:44 am

APTV: Fibonacci Analysis - Aptiv PLC
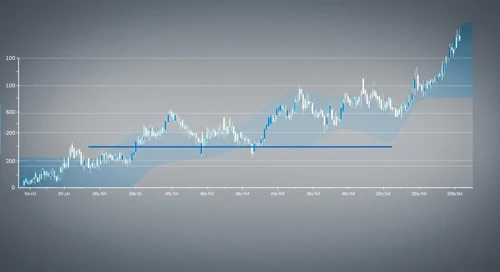
Aptiv PLC has shown a robust performance reflecting its strength in the vehicle components market. With its engagement in advanced safety and user experience solutions, the company has positioned itself well against its peers. Currently, technical indicators from a recent upward trend suggest potential significant price retracement levels.
Fibonacci Analysis
| Attributes | Details |
|---|---|
| Trend Start Date | 2025-05-05 |
| Trend End Date | 2025-08-15 |
| Highest Price | $74.72 (2025-08-13) |
| Lowest Price | $58.78 (2025-05-05) |
| Fibonacci Levels |
|
| Current Price | $74.18 |
| Current Retracement Zone | None |
The current price is above all Fibonacci retracement levels, indicating that it is not in any retracement zone. This could imply that the price strength is pushing away from prior support levels, potentially looking towards new highs.
Conclusion
Aptiv PLC's recent upward trend suggests strong bullish momentum, potentially driven by its strategic position in the vehicle component market. With technical indicators showing a price above major Fibonacci retracement levels, there is little evidence of an immediate pullback. However, investors should remain cautious of market volatilities that could generate resistance at current levels. Overall, the company's trajectory remains positive, with opportunities for profit if current momentum persists.
Smart Data Insight
Master the Perfect Entry & Exit for this Stock
Don't leave your profits to chance. Historically, this stock follows specific seasonal patterns that institutional traders use to maximize returns.
- ✅ Identify the "Golden Buying Window"
- ✅ Avoid high-risk correction cycles
- ✅ Backtested data from the last 20+ years