May 11, 2026 a 03:15 am
APP: Trend and Support & Resistance Analysis - AppLovin Corporation
The AppLovin Corporation, a leading player in the mobile app industry, is currently experiencing a market downtrend. With recent fluctuations, the stock's technical indicators and trends suggest potential volatility. Investors should pay close attention to support and resistance zones as they navigate this environment. Key software solutions of the company serve numerous business clients, which might play a pivotal role in future stock movement. This analysis highlights the recent trends and provides guidance for potential investment opportunities and risks.
Trend Analysis
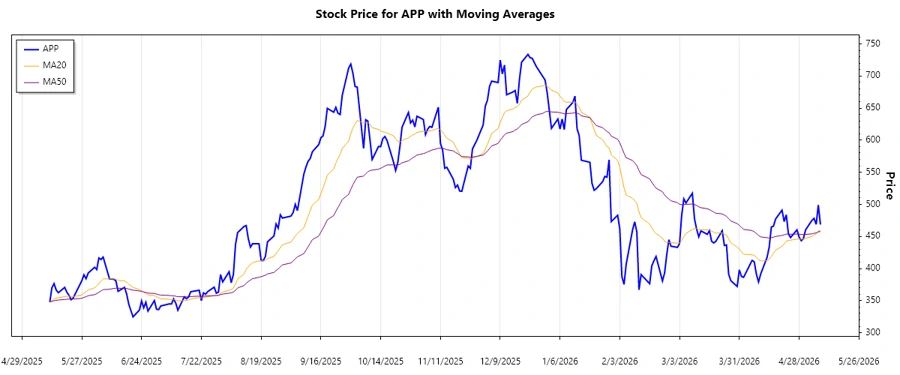
Analysis of the recent daily price data indicates that the stock is experiencing a consistent downward trend. This is confirmed by the calculation of the Exponential Moving Averages (EMAs). The EMA20 is currently below the EMA50, suggesting a dominant ▼ downtrend. Below is the price and trend behavior over the last week.
| Date | Closing Price | Trend |
|---|---|---|
| 2026-05-08 | 468.55 | ▼ |
| 2026-05-07 | 498.87 | ▼ |
| 2026-05-06 | 468.83 | ▼ |
| 2026-05-05 | 478.11 | ▼ |
| 2026-05-04 | 475.00 | ▼ |
| 2026-05-01 | 460.00 | — |
| 2026-04-30 | 446.35 | ▼ |
The consistency in the ⬇️ downtrend is a strong indicator of bearish market sentiment. This suggests that the stock might continue to experience declines unless significant positive catalysts appear.
Support- and Resistance
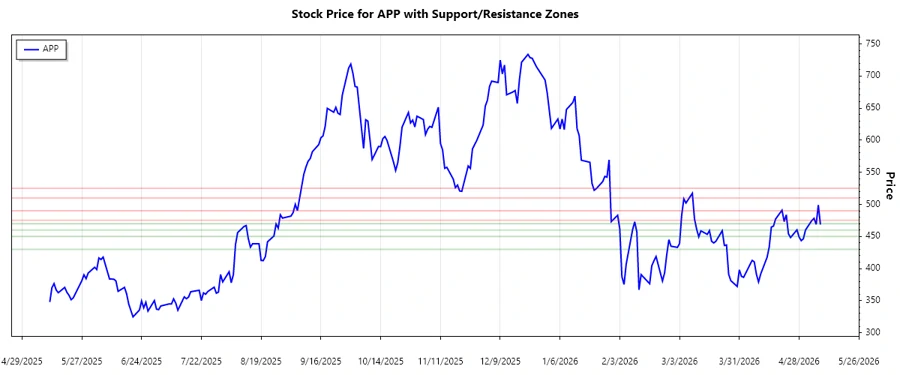
The current market data suggests the presence of key support- and resistance zones. The recent price analysis indicates two prominent resistance zones formed at higher price levels and two support zones at lower levels. These can be pivotal in determining future price movements.
| Zone Type | Zone Start | Zone End |
|---|---|---|
| Resistance 1 | 475.00 | 490.00 |
| Resistance 2 | 510.00 | 525.00 |
| Support 1 | 460.00 | 470.00 |
| Support 2 | 430.00 | 450.00 |
Currently, the price is near the support zone 1. If the price continues to stay within this zone, it signals a possible stabilization. Breaking below could lead to further declines.
Conclusion
The analysis indicates the AppLovin Corporation stock is experiencing a ▼ downtrend. As it hovers near a crucial support zone, any dip may result in accelerated selling pressure. However, the established support may act as a buffer for the stock, providing potential opportunities for investors looking at long-term appreciation. Careful monitoring of upcoming market catalysts and the stock's movement through identified zones will be crucial for making informed investment decisions.
Smart Data Insight
Master the Perfect Entry & Exit for this Stock
Don't leave your profits to chance. Historically, this stock follows specific seasonal patterns that institutional traders use to maximize returns.
- ✅ Identify the "Golden Buying Window"
- ✅ Avoid high-risk correction cycles
- ✅ Backtested data from the last 20+ years