June 27, 2026 a 10:15 am

APP: Fibonacci Analysis - AppLovin Corporation
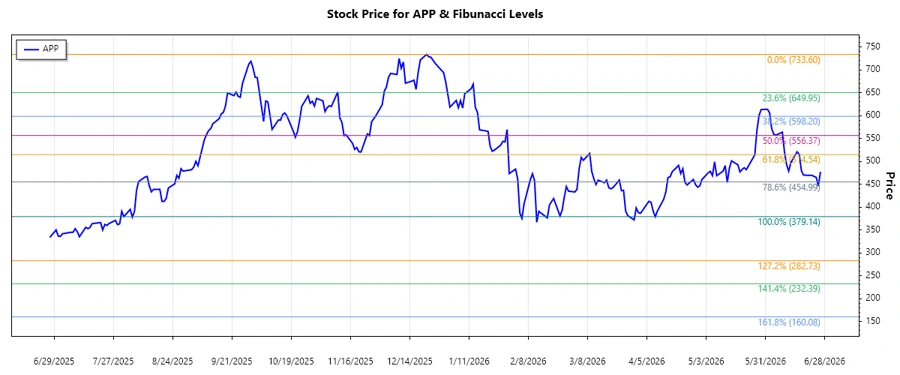
The stock price of AppLovin Corporation has shown significant variability over the analyzed period, corresponding with varying investor sentiment and economic factors affecting the tech market. Despite the overall downtrend observed, the company remains resilient with its innovative services focused on the growth of mobile applications. As of the latest data, market analysts keep a keen eye on potential recovery signals within technical retracement zones.
Fibonacci Analysis
| Attribute | Details |
|---|---|
| Trend Start Date | 2025-12-22 |
| Trend End Date | 2026-06-26 |
| High Price | $733.60 on 2025-12-22 |
| Low Price | $379.14 on 2026-04-09 |
| Fibonacci Levels |
|
| Current Price | $477.08 |
| Retracement Zone | 0.236 |
| Interpretation | The current price lies in the 0.236 retracement zone, which may provide a potential level of support, suggesting a possible consolidation phase. |
| Conclusion | Technically, if the stock holds above this level, a short-term recovery could be anticipated, but a fall below might expose it to further declines. |
Conclusion
The analysis of AppLovin Corporation's stock indicates ongoing challenges with a recent decline from its previous highs. However, the presence in the 0.236 Fibonacci retracement zone could hint at a technical support level where buyers might step in. The company's robust product offerings and expansion into global markets continue to attract interest from investors, although volatility remains a significant risk. Analysts should consider external economic factors and potential recovery signals as part of their comprehensive evaluation.
Smart Data Insight
Master the Perfect Entry & Exit for this Stock
Don't leave your profits to chance. Historically, this stock follows specific seasonal patterns that institutional traders use to maximize returns.
- ✅ Identify the "Golden Buying Window"
- ✅ Avoid high-risk correction cycles
- ✅ Backtested data from the last 20+ years