July 03, 2026 a 11:43 am

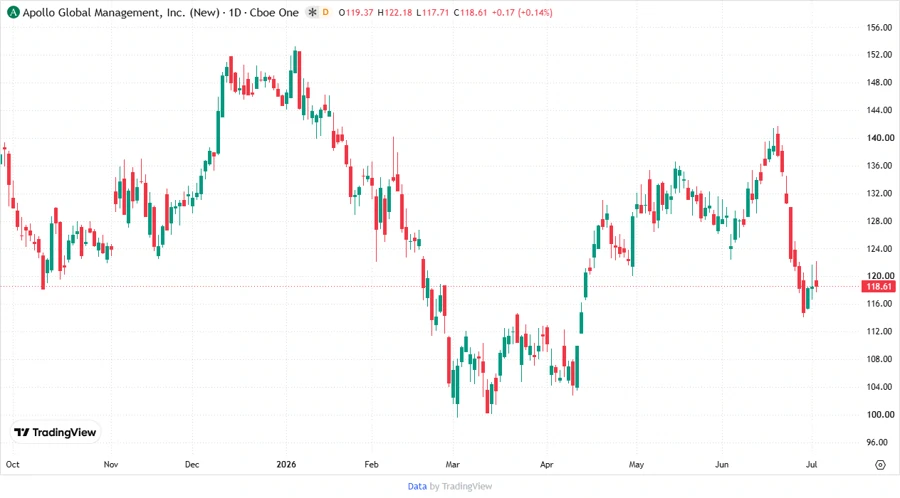
APO: Fundamental Ratio Analysis - Apollo Global Management, Inc.
Apollo Global Management stands strong with its diversified investment strategies spanning multiple asset classes. The company's focus on intrinsic value and distressed situations offers a robust investment model. However, fluctuations in global markets and economic conditions pose inherent risks.
Fundamental Rating
Apollo Global Management's fundamental strength is indicated by a mixed score sheet, reflecting opportunities for improvement in certain financial metrics.
| Category | Score | Visualization |
|---|---|---|
| Overall Rating | B- | |
| Discounted Cash Flow | 4 | |
| Return on Equity | 4 | |
| Return on Assets | 2 | |
| Debt to Equity | 2 | |
| Price to Earnings | 1 | |
| Price to Book | 1 |
Historical Rating
Comparing recent historical performance shows consistent scoring in key metrics, ensuring a stable outlook.
| Date | Overall Score | DCF | ROE | ROA | D/E | P/E | P/B |
|---|---|---|---|---|---|---|---|
| 2026-07-02 | 2 | 4 | 4 | 2 | 2 | 1 | 1 |
| Prior | 0 | 4 | 4 | 2 | 2 | 1 | 1 |
Analyst Price Targets
Apollo's price targets reflect strong market confidence with high potential growth indicated by current targets.
| High | Low | Median | Consensus |
|---|---|---|---|
| 165 | 142 | 153.5 | 153.5 |
Analyst Sentiment
Investor sentiment is predominantly positive, bolstered by numerous buy recommendations.
| Recommendation | Count | Proportion |
|---|---|---|
| Strong Buy | 0 | |
| Buy | 23 | |
| Hold | 5 | |
| Sell | 0 | |
| Strong Sell | 0 |
Summary
Apollo Global Management presents a compelling investment case with a strong portfolio in diverse sectors. Despite some weaknesses in fundamental metrics such as P/E and P/B ratios, the company's strength in DCF and ROE aligns with positive analyst sentiment. Future investment will likely depend on market conditions and management's ability to navigate economic uncertainties.
This HTML code structures an analysis for Apollo Global Management, Inc.'s stock (APO) optimized for mobile integration and responsive design. It provides a summary with images, scores, and visual representations to aid in understanding the firm's financial health and market expectations.
Smart Data Insight
Master the Perfect Entry & Exit for this Stock
Don't leave your profits to chance. Historically, this stock follows specific seasonal patterns that institutional traders use to maximize returns.
- ✅ Identify the "Golden Buying Window"
- ✅ Avoid high-risk correction cycles
- ✅ Backtested data from the last 20+ years