April 14, 2026 a 06:44 am
APO: Fibonacci Analysis - Apollo Global Management, Inc.
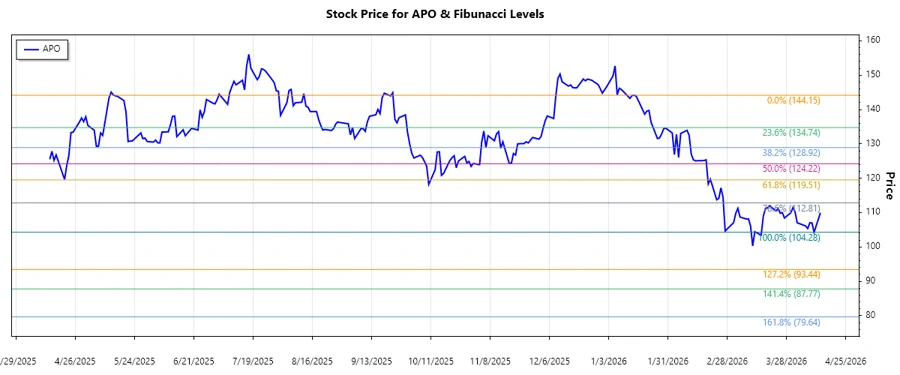
Apollo Global Management, Inc. has recently experienced a significant downtrend, reflecting broader market sentiments. The asset manager has been focused on restructuring its portfolio, which is heavily invested in real estate and private equity deals. Analyst sentiment suggests cautious optimism as the company navigates volatile market conditions while leveraging its diversified asset base.
Fibonacci Analysis
| Detail | Information |
|---|---|
| Start Date | 2026-01-15 |
| End Date | 2026-04-13 |
| High Point | 144.15 (2026-01-15) |
| Low Point | 104.28 (2026-04-10) |
| Fibonacci Level | Price |
|---|---|
| 0.236 | 114.28 |
| 0.382 | 118.79 |
| 0.5 | 124.22 |
| 0.618 | 129.65 |
| 0.786 | 135.60 |
The current price is in the 0.236 retracement zone, which might indicate that the price could face resistance at this level.
The technical analysis suggests that while the stock is recovering from a recent downtrend, the 0.236 level is an important resistance point to observe for further potential price increases.
Conclusion
Apollo Global Management's stock is recovering from a significant downturn earlier in the year. While Fibonacci retracement levels suggest potential resistance zones, the company’s diversified investment portfolio could buffer against extended declines. Analysts continue to keep an eye on global market trends that may affect private equity and real estate markets. Investors should note the firm’s strategic moves in distressed assets and alternative investments, as these might present new opportunities. Maintaining vigilance over support and resistance levels will be crucial in forming investment opinions. Technical indicators should be complemented with fundamental analysis for a holistic view.