November 06, 2025 a 11:44 am
APO: Fibonacci Analysis - Apollo Global Management, Inc.
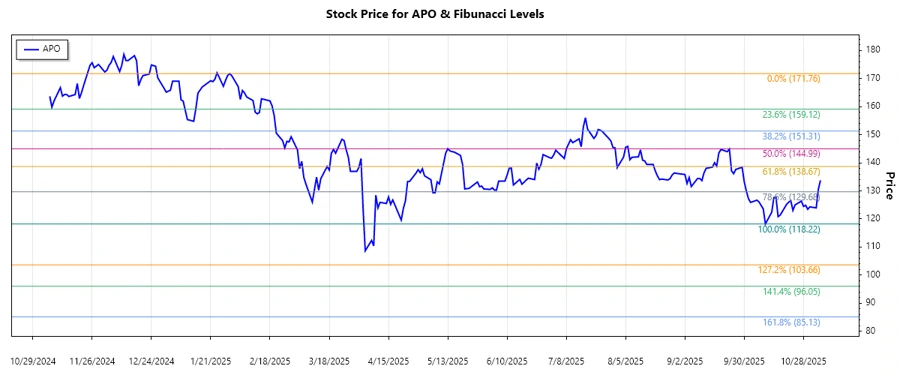
Apollo Global Management, Inc. (APO) has shown a significant downward trend in recent months. The company's stock, which specializes in private equity, credit, and real estate investments, has experienced fluctuations influenced by various global market dynamics. As we explore the Fibonacci retracement levels, investors may identify potential areas of support and resistance, crucial for making informed trading decisions.
Fibonacci Analysis
| Details | Information |
|---|---|
| Trend Type | Downward |
| Start Date | 2025-02-04 |
| End Date | 2025-11-05 |
| High (Price & Date) | $171.76 on 2025-01-30 |
| Low (Price & Date) | $118.22 on 2025-10-10 |
Fibonacci Retracement Levels
| Level | Price |
|---|---|
| 0.236 | $127.31 |
| 0.382 | $135.05 |
| 0.5 | $144.99 |
| 0.618 | $154.93 |
| 0.786 | $165.56 |
The current price is within the 0.236 retracement area, indicating a potential resistance level. Traders should watch for a breakout or reversal around this level to gauge future movements in the stock.
Conclusion
In conclusion, Apollo Global Management, Inc. is currently experiencing a downtrend. While the stock may encounter resistance at the 0.236 Fibonacci level, a sustained recovery could see higher retracement levels acting as potential resistance zones. Investors should weigh the firm's broad investment exposure against economic headwinds. The stock's future performance will likely hinge on macroeconomic factors and the firm's strategic response. Analysts might remain cautious given the current market dynamics and the technical signals observed.
Smart Data Insight
Master the Perfect Entry & Exit for this Stock
Don't leave your profits to chance. Historically, this stock follows specific seasonal patterns that institutional traders use to maximize returns.
- ✅ Identify the "Golden Buying Window"
- ✅ Avoid high-risk correction cycles
- ✅ Backtested data from the last 20+ years