
July 20, 2026 a 07:46 am
APO: Dividend Analysis - Apollo Global Management, Inc.
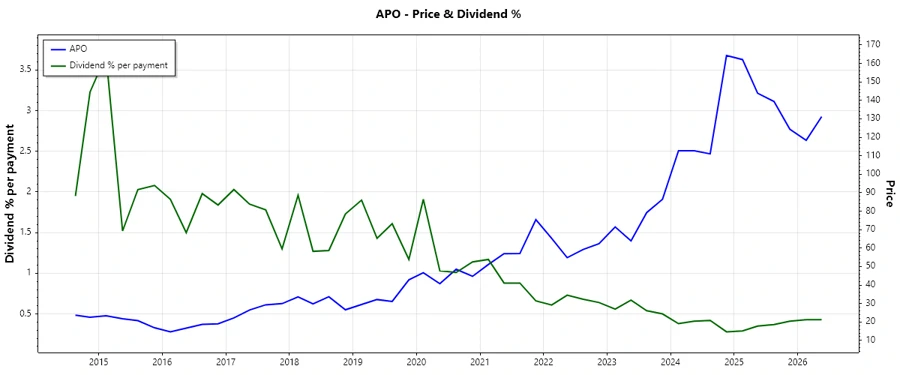
Apollo Global Management, Inc. is known for its strategic investments and robust financial framework, which is reflected in its consistent dividend payments over the years. However, the modest dividend yield may not attract income-focused investors but indicates the company’s focus on long-term value growth.
📊 Overview
A comprehensive analysis of Apollo Global Management highlights its stable sector performance in the financial industry with a dividend yield of 1.60%. The current dividend per share is 2.14 USD, maintaining a 16-year streak without suspensions, indicating significant dividend reliability.
| Metric | Details |
|---|---|
| Sector | Finance |
| Dividend Yield | 1.60% |
| Current Dividend per Share | 2.14 USD |
| Dividend History | 16 years |
| Last Cut or Suspension | None |
📉 Dividend History
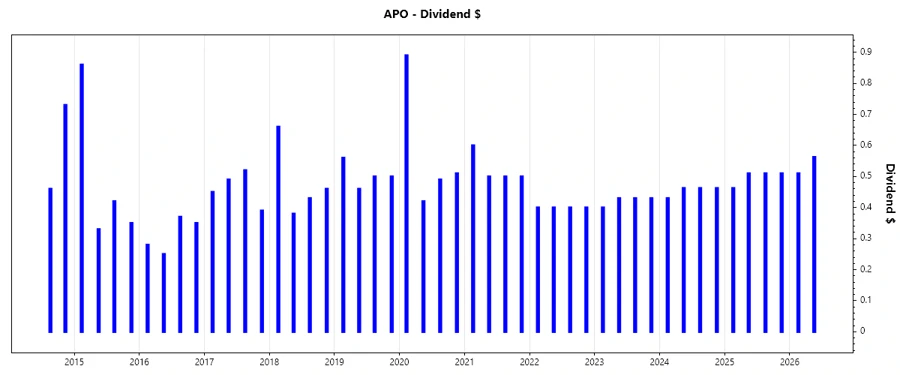
The 16-year dividend history underlines Apollo's commitment to shareholders. Evaluating past dividends is vital for gauging future expectations, determining consistency, and understanding the growth trajectory.
| Year | Dividend per Share (USD) |
|---|---|
| 2026 | 1.0725 |
| 2025 | 1.9925 |
| 2024 | 1.8175 |
| 2023 | 1.69 |
| 2022 | 1.6 |
📈 Dividend Growth
The growth in dividends over multi-year periods is an indicator of a company’s increased profitability and confidence in future earnings. Growth analysis helps in assessing the potential for increasing shareholder returns.
| Time | Growth |
|---|---|
| 3 years | 7.59% |
| 5 years | -2.91% |
The average dividend growth is -2.91% over 5 years. This shows a steady but slight decline in dividend growth, which might concern investors expecting aggressive growth.
✅ Payout Ratio
The payout ratio indicates the proportion of earnings a company distributes as dividends. Evaluating this metric helps investors assess the sustainability of a company's dividend policy.
| Key figure | Ratio |
|---|---|
| EPS-based | 59.09% |
| Free cash flow-based | 20.50% |
The EPS payout ratio of 59.09% is within a healthy range, indicating that the company's dividends are well-supported by its earnings. The lower FCF payout ratio of 20.50% suggests that dividends are secure, backed by strong cash flow management.
💰 Cashflow & Capital Efficiency
The effective management of cash flow and capital efficiency measures a company's ability to generate positive cash flow and its effectiveness in allocating capital.
| Year | 2025 | 2024 | 2023 |
|---|---|---|---|
| Free Cash Flow Yield | 8.47% | 3.36% | 11.67% |
| Earnings Yield | 5.09% | 4.57% | 9.01% |
| CAPEX to Operating Cash Flow | 0% | 0% | 0% |
| Stock-based Compensation to Revenue | 2.31% | 2.76% | 3.14% |
| Free Cash Flow / Operating Cash Flow Ratio | 100% | 100% | 100% |
The company exhibits robust cash flow stability and efficient capital allocation, reflected in stable free cash flow yields and consistent returns on invested capital.
🗣️ Balance Sheet & Leverage Analysis
A strong balance sheet and an optimal debt structure indicate financial soundness. Assessing leverage helps in analyzing risk levels related to debt servicing obligations.
| Year | 2025 | 2024 | 2023 |
|---|---|---|---|
| Debt-to-Equity | 0.57 | 0.61 | 0.58 |
| Debt-to-Assets | 0.03 | 0.03 | 0.03 |
| Debt-to-Capital | 0.36 | 0.38 | 0.37 |
| Net Debt to EBITDA | -0.56 | -0.63 | -1.18 |
| Current Ratio | 0.78 | 0.80 | 0.82 |
| Quick Ratio | 0.78 | 0.80 | 0.82 |
| Financial Leverage | 19.75 | 21.90 | 22.32 |
With low debt ratios and high leverage, Apollo's balance sheet supports financial stability, although liquidity ratios suggest caution in managing immediate liabilities.
Fundamental Strength & Profitability
Robust profitability ratios and comprehensive financial metrics demonstrate the company’s operational efficiency and competitive advantage in the market.
| Year | 2025 | 2024 | 2023 |
|---|---|---|---|
| Return on Equity | 19.20% | 25.65% | 34.76% |
| Return on Assets | 0.97% | 1.17% | 1.56% |
| Margins: Net | 14.79% | 16.95% | 14.95% |
| EBIT | 31.18% | 29.77% | 17.90% |
| EBITDA | 34.61% | 33.89% | 20.36% |
| Gross | 88.47% | 95.63% | 96.85% |
| Research & Development to Revenue | 0% | 0% | 0% |
Apollo’s profitability, with high return on equity and solid margin figures, underscores financial resilience. However, negligible R&D expenses might suggest limited focus on innovation-driven advantages.
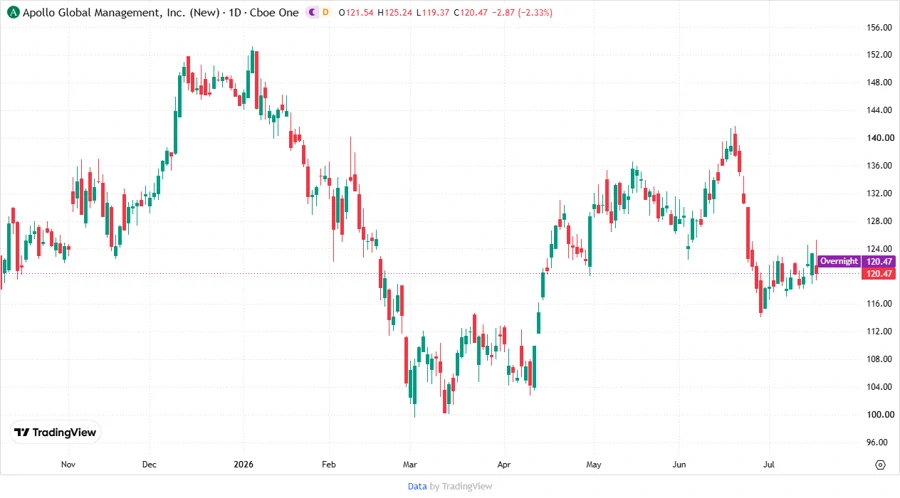
📈 Price Development
Dividend Scoring System
| Category | Score | Score Bar |
|---|---|---|
| Dividend Yield | 2 | |
| Dividend Stability | 5 | |
| Dividend Growth | 3 | |
| Payout Ratio | 4 | |
| Financial Stability | 4 | |
| Dividend Continuity | 5 | |
| Cashflow Coverage | 4 | |
| Balance Sheet Quality | 3 |
Total Score: 30/40
Rating
Apollo Global Management, Inc. exhibits robust financial performance with strong dividend continuity and moderate growth prospects. While the dividend yield is relatively low, the company's stable payout and financial resilience make it a preferred choice for conservative investors. A focus on long-term growth and stable dividends ensures a recommendation for balanced portfolios with a preference for steady income and capital preservation.
Smart Data Insight
Master the Perfect Entry & Exit for this Stock
Don't leave your profits to chance. Historically, this stock follows specific seasonal patterns that institutional traders use to maximize returns.
- ✅ Identify the "Golden Buying Window"
- ✅ Avoid high-risk correction cycles
- ✅ Backtested data from the last 20+ years