
July 16, 2026 a 07:31 am
APO: Dividend Analysis - Apollo Global Management, Inc.
Apollo Global Management, Inc., with its robust presence in the financial management sector, presents a promising avenue for dividend-seeking investors. Though the dividend growth over five years is slightly negative, the significant market cap and stable dividend history indicate ongoing financial stability. The firm's strong market presence is underscored by its consistent payouts over 16 years, marking its reliability in shareholder returns.
Overview 📊
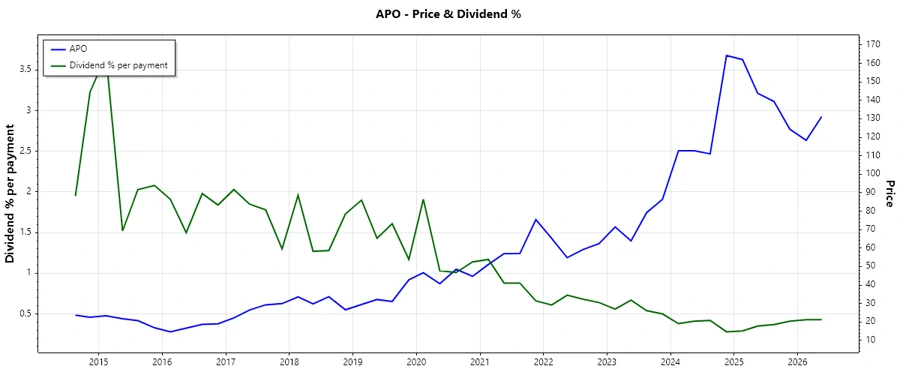
The financial management sector proves competitive, yet Apollo Global Management stands out with a current dividend yield of 1.60%. The consistent dividend per share of USD 2.14 reflects predictable income for investors, backed by its 16 years of unbroken dividend history. This track record boosts investor confidence despite recent fluctuations in growth.
| Metric | Value |
|---|---|
| Sector | Financial Management |
| Dividend yield | 1.60 % |
| Current dividend per share | 2.14 USD |
| Dividend history | 16 years |
| Last cut or suspension | None |
Dividend History 🗣️
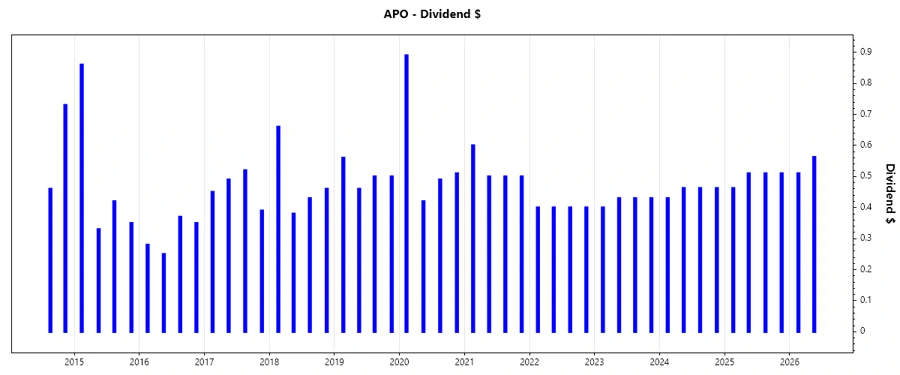
An analysis of Apollo's dividend history highlights its dedication to shareholder returns, vital for assessing the stability and reliability of income. The history indicates a steady payout pattern, which is crucial for income-focused investors.
| Year | Dividend Per Share (USD) |
|---|---|
| 2026 | 1.07 |
| 2025 | 1.99 |
| 2024 | 1.82 |
| 2023 | 1.69 |
| 2022 | 1.60 |
Dividend Growth 📈
Dividend growth serves as a bellwether for financial health and future payout capabilities, directly impacting stock attractiveness. Despite a minor negative growth in dividends over five years, Apollo shows positive growth in the recent three years.
| Time | Growth |
|---|---|
| 3 years | 7.59 % |
| 5 years | -2.91 % |
The average dividend growth is -2.91% over five years. This shows moderate but steady dividend growth potential.
Payout Ratio 📉
Payout ratios are critical indicators of a company's ability to sustain dividends. The EPS-based payout ratio stands at 59.09%, while the FCF-based is remarkably lower at 20.50%, suggesting a cautious yet sustainable approach to dividend policy.
| Key Figure | Ratio |
|---|---|
| EPS-based | 59.09 % |
| Free cash flow-based | 20.50 % |
The EPS payout ratio of 59.09% indicates a generous policy, yet the low FCF ratio also implies considerable reinvestment capacity, securing long-term growth.
Cashflow & Capital Efficiency ✅
Understanding cash flow dynamics alongside capital efficiency provides insights into operational health and strategic resource allocation. The Free Cash Flow Yield and Earnings Yield are promising, ensuring flexibility in capital allocation while maintaining low CAPEX requirements.
| Year | 2025 | 2024 | 2023 |
|---|---|---|---|
| Free Cash Flow Yield | 8.47 % | 3.36 % | 11.67 % |
| Earnings Yield | 5.09 % | 4.57 % | 9.01 % |
| CAPEX to Operating Cash Flow | 0 % | 0 % | 0 % |
| Stock-based Compensation to Revenue | 2.31 % | 2.76 % | 3.14 % |
| Free Cash Flow / Operating Cash Flow Ratio | 100 % | 100 % | 100 % |
The free cash flow resilience highlights financial flexibility, positioning Apollo well for unexpected challenges and growth opportunities.
Balance Sheet & Leverage Analysis ⚠️
Examining leverage metrics reveals Apollo's risk management. Low debt ratios versus equity and assets underscore its strategic financial positioning, securing operational continuity.
| Year | 2025 | 2024 | 2023 |
|---|---|---|---|
| Debt-to-Equity | 57.26 % | 61.37 % | 57.62 % |
| Debt-to-Assets | 2.90 % | 2.80 % | 2.58 % |
| Debt-to-Capital | 36.41 % | 38.03 % | 36.56 % |
| Net Debt to EBITDA | -0.56 | -0.63 | -1.18 |
| Current Ratio | 78.44 % | 80.00 % | 81.60 % |
| Quick Ratio | 78.44 % | 80.00 % | 81.60 % |
| Financial Leverage | 1,974.85 % | 2,190.31 % | 2,232.18 % |
Key metrics reflect a conservative leverage policy ensuring liquidity and safeguarding against excessive financial burdens.
Fundamental Strength & Profitability 📊
End-to-end financial performance showcases Apollo's compelling profitability and strategic efficiency. High return metrics and favorable margins demonstrate well-sustained business development.
| Year | 2025 | 2024 | 2023 |
|---|---|---|---|
| Return on Equity | 19.20 % | 25.65 % | 34.76 % |
| Return on Assets | 0.97 % | 1.17 % | 1.56 % |
| Margins: Net | 14.79 % | 16.95 % | 14.95 % |
| EBIT | 31.18 % | 29.77 % | 17.90 % |
| EBITDA | 34.61 % | 33.89 % | 20.36 % |
| Gross | 88.47 % | 95.63 % | 96.85 % |
| R&D to Revenue | 0 % | 0 % | 0 % |
Apollo's margin profile is remarkably strong, driven by minimal costs and scalable operations across the board.
Price Development 📈
Dividend Scoring System ✅
| Criteria | Score | |
|---|---|---|
| Dividend Yield | 3 | |
| Dividend Stability | 5 | |
| Dividend Growth | 2 | |
| Payout Ratio | 4 | |
| Financial Stability | 4 | |
| Dividend Continuity | 5 | |
| Cashflow Coverage | 4 | |
| Balance Sheet Quality | 4 |
Total Score: 31/40
Rating 🗞️
The evaluation of Apollo Global Management, Inc. highlights a robust dividend strategy balanced with financial stability. Although slight challenges with growth persist, its stable payout, financial prudence, and operational efficiencies make it a commendable investment for income-focused portfolios. Investors may consider it a reliable candidate for stable income amidst moderate growth expectations.
Smart Data Insight
Master the Perfect Entry & Exit for this Stock
Don't leave your profits to chance. Historically, this stock follows specific seasonal patterns that institutional traders use to maximize returns.
- ✅ Identify the "Golden Buying Window"
- ✅ Avoid high-risk correction cycles
- ✅ Backtested data from the last 20+ years