May 17, 2026 a 12:46 pm

APO: Dividend Analysis - Apollo Global Management, Inc.
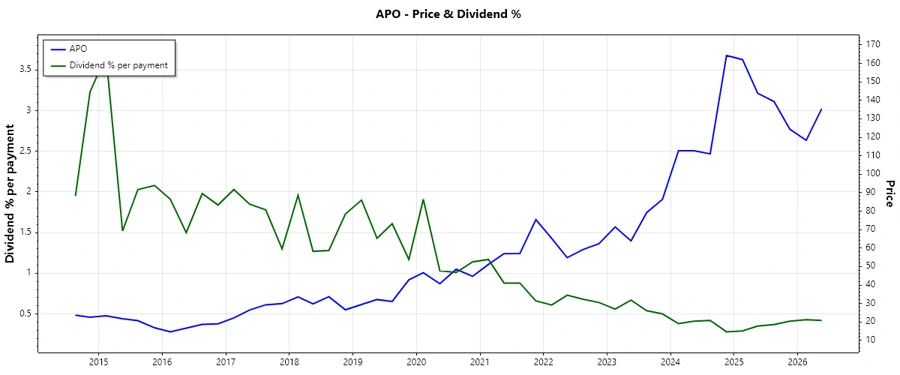
The dividend profile of Apollo Global Management, Inc. demonstrates a relatively modest yield with room for growth. Despite slight fluctuations, the extensive dividend history and consistent payments over the years indicate stability. However, growth over recent years has been negligible, calling for a strategic evaluation going forward to improve shareholder returns.
Overview 📊
Apollo Global Management operates within the Financial Sector, providing a dividend yield of 1.55%. Over 16 years, the company has demonstrated dividend resilience, despite recent hurdles. Current dividends per share are at $2.13, and remarkably, the firm has not experienced any recent dividend cuts or suspensions.
| Metric | Value |
|---|---|
| Sector | Financial |
| Dividend yield | 1.55% |
| Current dividend per share | 2.14 USD |
| Dividend history | 16 years |
| Last cut or suspension | None |
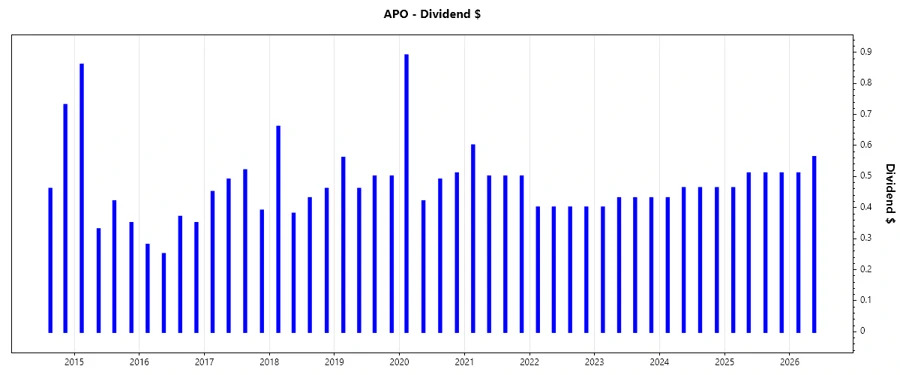
Dividend History 📉
Understanding the dividend history is crucial for evaluating the firm's commitment to distributing profits back to its shareholders. For Apollo, this demonstrates consistency across a challenging economic landscape.
| Year | Dividend per Share (USD) |
|---|---|
| 2026 | 1.0725 |
| 2025 | 1.9925 |
| 2024 | 1.8175 |
| 2023 | 1.69 |
| 2022 | 1.6 |
Dividend Growth 📈
Dividend growth provides insight into the company's future payout capabilities. In the last three years, the growth has been 0.08%, while a five-year assessment shows a decrease of -0.03%. This consistency, albeit negative, indicates a potential for upward revisions if management pivots strategies effectively.
| Time | Growth |
|---|---|
| 3 years | 7.59% |
| 5 years | -2.91% |
The average dividend growth is -2.91% over five years. This shows a moderate decline, signaling a need for renewed focus on growth strategies.
Payout Ratio ✅
The payout ratio is an important measure of sustainability and signals how well earnings support dividend payouts. Apollo reports an EPS-based payout ratio of 59.09% and an FCF-based ratio of 20.50%. These figures suggest the dividends are well-covered by the company's earnings, although growth capabilities may remain constrained.
| Key figure | Ratio |
|---|---|
| EPS-based | 59.09% |
| Free cash flow-based | 20.50% |
Cashflow & Capital Efficiency 💰
Cash flow insights are critical to understanding the company’s ability to maintain dividend payments. In recent historical data, free cash flow yields ranged significantly, indicating variable cash flow generation capabilities. Investment in CAPEX was negligible, ensuring most operating cash is preserved, and stock-based compensation remains a marginal expense compared to revenue.
| Metric | 2023 | 2024 | 2025 |
|---|---|---|---|
| Free Cash Flow Yield | 11.67% | 3.36% | 8.47% |
| Earnings Yield | 9.01% | 4.57% | 5.09% |
| CAPEX to Operating Cash Flow | 0% | 0% | 0% |
| Stock-based Compensation to Revenue | 3.14% | 2.76% | 2.31% |
| Free Cash Flow / Operating Cash Flow Ratio | 1 | 1 | 1 |
Balance Sheet & Leverage Analysis 📊
The balance sheet provides a snapshot into the firm's financial stability and leverage. Apollo’s low debt ratios suggest prudent fiscal management, maintaining a strong capital position even amidst economic variability. However, high financial leverage signifies potential areas of concern in high-interest rate environments without proportionate income growth.
| Metric | 2023 | 2024 | 2025 |
|---|---|---|---|
| Debt-to-Equity | 0.57 | 0.61 | 0.57 |
| Debt-to-Assets | 0.03 | 0.03 | 0.03 |
| Debt-to-Capital | 0.37 | 0.38 | 0.36 |
| Net Debt to EBITDA | -1.18 | -0.63 | -0.56 |
| Current Ratio | 0.82 | 0.80 | 0.78 |
| Quick Ratio | 0.82 | 0.80 | 0.78 |
| Financial Leverage | 22.32 | 21.90 | 19.75 |
Fundamental Strength & Profitability 📈
Analysis of fundamental performance metrics reveals strong profitability insights with consistent returns on equity and noteworthy asset utilization. This strength underscores Apollo's effective capital allocation and operational efficiency.
| Metric | 2023 | 2024 | 2025 |
|---|---|---|---|
| Return on Equity | 34.76% | 25.65% | 19.20% |
| Return on Assets | 1.56% | 1.17% | 0.97% |
| Margins: Net | 14.95% | 16.95% | 14.79% |
| Margins: EBIT | 17.90% | 29.77% | 31.18% |
| Margins: EBITDA | 20.36% | 33.89% | 34.61% |
| Margins: Gross | 96.85% | 95.63% | 88.47% |
| Research & Development to Revenue | 0% | 0% | 0% |
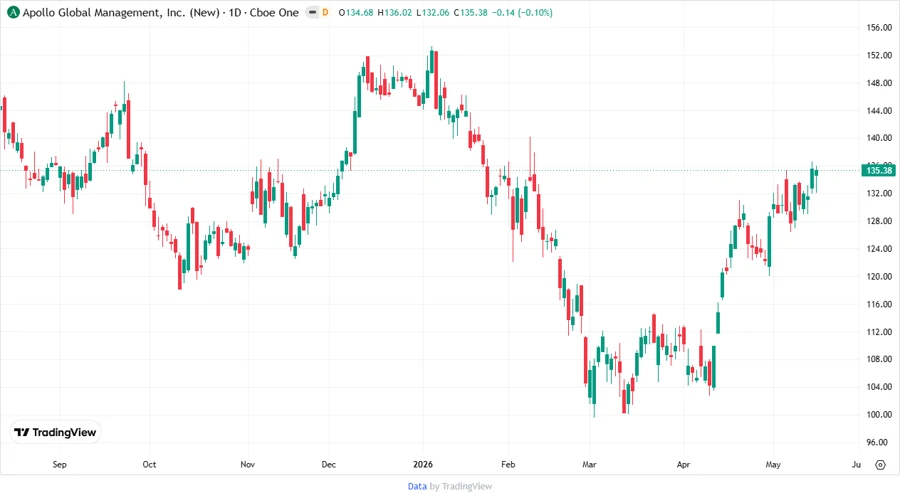
Price Development 📉
Dividend Scoring System 🗣️
| Criteria | Score | Score Bar |
|---|---|---|
| Dividend yield | 3 | |
| Dividend Stability | 4 | |
| Dividend growth | 2 | |
| Payout ratio | 4 | |
| Financial stability | 4 | |
| Dividend continuity | 5 | |
| Cashflow Coverage | 4 | |
| Balance Sheet Quality | 4 |
Total Score: 30/40
Rating 🌟
In conclusion, Apollo Global Management, Inc. offers a stable dividend backed by strong cash flow coverage and financial stability. However, growth potential remains an area needing enhancement. This analysis suggests a cautious but positive outlook for dividend reliability, with recommendations to closely monitor strategic shifts that could enhance share value growth in the coming years.
Smart Data Insight
Master the Perfect Entry & Exit for this Stock
Don't leave your profits to chance. Historically, this stock follows specific seasonal patterns that institutional traders use to maximize returns.
- ✅ Identify the "Golden Buying Window"
- ✅ Avoid high-risk correction cycles
- ✅ Backtested data from the last 20+ years