December 24, 2025 a 03:31 pm

APO: Dividend Analysis - Apollo Global Management, Inc.
🗣️ Apollo Global Management, Inc., established for over 15 years with dividends, presents a promising yet cautious opportunity for income-focused investors. While the dividend yield of 1.60% seems modest, its sustainable payout and resilience through economic fluctuations may appeal to those prioritizing stability over higher yields. Recent cuts underscore the importance of monitoring fiscal strategies for sustained income generation.
📊 Overview
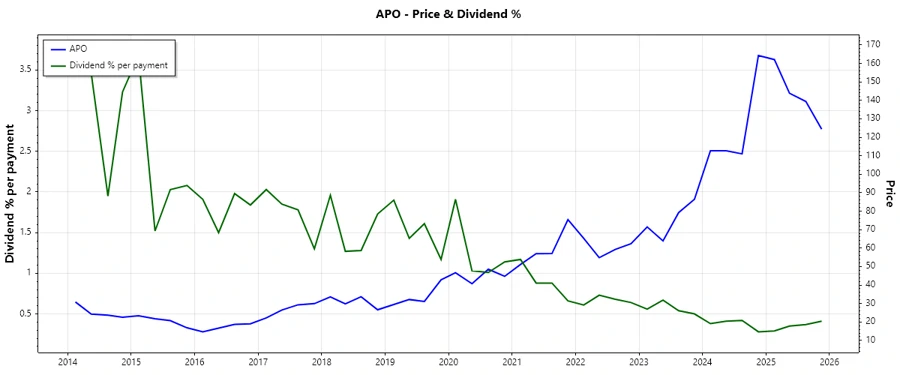
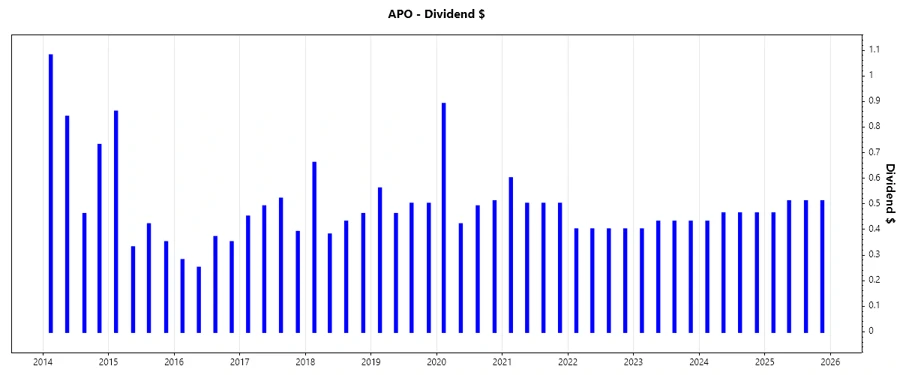
Apollo Global Management operates in the financial sector, offering a dividend yield of 1.60%. It currently distributes $2.03 per share in dividends. Having maintained a 15-year-long dividend history, the firm showcases its dedication to shareholder returns, although it noted a cut in 2022.
| Metric | Detail |
|---|---|
| Sector | Financial |
| Dividend Yield | 1.60% |
| Current Dividend Per Share | $2.03 |
| Dividend History | 15 years |
| Last Cut or Suspension | 2022 |
📈 Dividend History
Understanding the historical dividend payments is crucial in assessing the company's commitment to shareholder returns. Analyzing the past payouts helps investors gauge reliability and consistency over market cycles.
| Year | Dividend per Share |
|---|---|
| 2025 | $1.9925 |
| 2024 | $1.8175 |
| 2023 | $1.69 |
| 2022 | $1.60 |
| 2021 | $2.10 |
💹 Dividend Growth
Evaluating dividend growth trends is essential for projecting future income. Apollo's recent dividend growth suggests caution with moderate adjustments over the past years.
| Time | Growth |
|---|---|
| 3 years | -0.05% |
| 5 years | -0.02% |
The average dividend growth is -0.02% over 5 years. This shows moderate but steady dividend growth with some recent declines indicating the need for cautious optimism.
🔎 Payout Ratio
Payout ratios are critical in understanding dividend sustainability. A lower EPS-based payout ratio indicates a stronger potential for sustained dividends, whereas a higher FCF-based ratio underscores potential profitability stress.
| Key figure | Ratio |
|---|---|
| EPS-based | 28.25% |
| Free cash flow-based | 45.77% |
With an EPS payout ratio of 28.25%, the dividends appear sustainable. However, a higher free cash flow ratio at 45.77% introduces caution necessitating close monitoring of liquidity and cash flow efficiency.
💰 Cashflow & Capital Efficiency
Cash flow and capital metrics provide insight into operational efficiency and liquidity management. They highlight the firm's ability to generate cash relative to its liabilities and capital expenditure.
| Year / Metric | 2024 | 2023 | 2022 |
|---|---|---|---|
| Free Cash Flow Yield | 3.36% | 11.67% | 9.62% |
| Earnings Yield | 4.57% | 9.01% | -5.26% |
| CAPEX to Operating Cash Flow | 0% | 0% | 5.35% |
| Stock-based Compensation to Revenue | 2.76% | 3.14% | 4.92% |
| Free Cash Flow / Operating Cash Flow Ratio | 1 | 1 | 0.95 |
The free cash flow yield coupled with stable earnings underscores efficiency, although declining trends warrant strategic capital allocation to boost sustainability.
📉 Balance Sheet & Leverage Analysis
Understanding the balance sheet and leverage ratios is essential for assessing financial health and debt management. Leverage positions signal the company's ability to manage liabilities and fund growth.
| Year / Metric | 2024 | 2023 | 2022 |
|---|---|---|---|
| Debt-to-Equity | 0.61 | 0.58 | 1.08 |
| Debt-to-Assets | 0.03 | 0.03 | 0.03 |
| Debt-to-Capital | 0.38 | 0.37 | 0.52 |
| Net Debt to EBITDA | -0.63 | -1.18 | 0.65 |
| Current Ratio | 0.80 | 0.82 | 0.73 |
| Quick Ratio | 0.80 | 0.82 | 0.73 |
| Financial Leverage | 21.90 | 22.32 | 38.74 |
Despite a high debt level, a decreasing leverage ratio coupled with improved liquidity highlights efforts toward solidifying financial stability, albeit needing further strategic alignment.
🔍 Fundamental Strength & Profitability
Profitability ratios assess core operational capacity and investment returns. They reflect the company's ability to generate profits relative to equity, assets, and invested capital.
| Year / Metric | 2024 | 2023 | 2022 |
|---|---|---|---|
| Return on Equity | 25.65% | 34.76% | -29.53% |
| Return on Assets | 1.17% | 1.56% | -0.76% |
| Return on Invested Capital | 6.57% | 7.38% | -4.96% |
| Net Margin | 16.95% | 14.95% | -17.88% |
| EBIT Margin | 29.77% | 17.90% | -36.70% |
| EBITDA Margin | 33.89% | 20.36% | -31.87% |
| Gross Margin | 95.63% | 96.85% | 91.55% |
| Research & Development to Revenue | 0% | 0% | 0% |
Positive profitability ratios denote adequate capital deployment, though margin challenges indicate potential volatility, necessitating strategic focus on improving core operations.
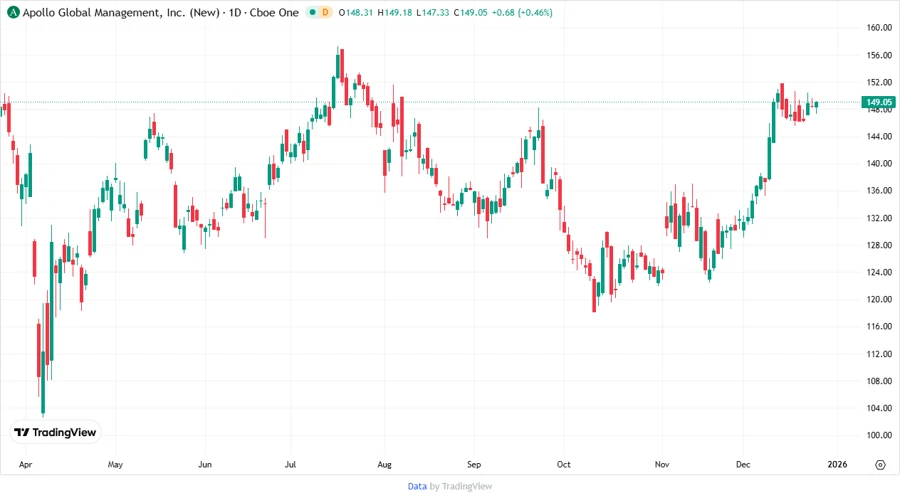
📊 Price Development
🔍 Dividend Scoring System
| Criterion | Score | Score Bar |
|---|---|---|
| Dividend yield | 3 | |
| Dividend Stability | 3 | |
| Dividend Growth | 2 | |
| Payout ratio | 4 | |
| Financial stability | 3 | |
| Dividend continuity | 3 | |
| Cashflow Coverage | 4 | |
| Balance Sheet Quality | 3 |
Total Score: 25 out of 40
📈 Rating
Apollo Global Management exhibits moderate dividend appeal with an emphasis on stability amidst economic fluctuations. Continuous monitoring of fiscal policies and market conditions is advised, particularly stemming from past dividend cuts. This may be suitable for investors with a medium to low risk appetite focused on stable income streams.