December 08, 2025 a 07:46 am

📊 APO: Dividend Analysis - Apollo Global Management, Inc.
Apollo Global Management, Inc. showcases a robust dividend history with a strong market presence. However, recent trends indicate moderate challenges with dividend cuts. Understanding these dynamics provides a comprehensive view of APO's dividend appeal.
🗣️ Overview
| Metric | Value |
|---|---|
| Sector | Financials |
| Dividend Yield | 1.60 % |
| Current Dividend per Share | 2.03 USD |
| Dividend History | 15 years |
| Last Cut or Suspension | 2022 |
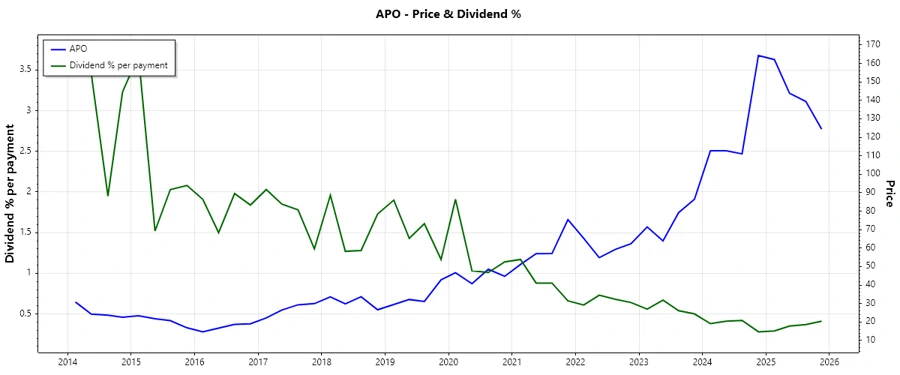
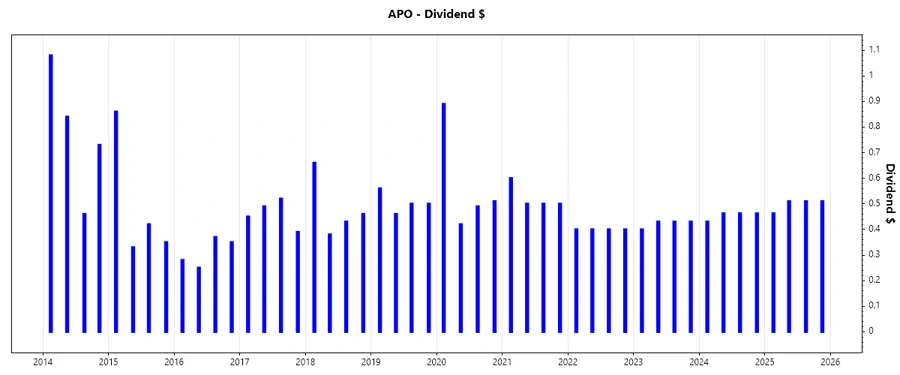
📈 Dividend History
The historical overview highlights the company's commitment to yield distribution, while acknowledging recent strategic adjustments.
| Year | Dividend per Share |
|---|---|
| 2025 | 1.9925 USD |
| 2024 | 1.8175 USD |
| 2023 | 1.69 USD |
| 2022 | 1.6 USD |
| 2021 | 2.1 USD |
📈 Dividend Growth
Apollo Global Management's dividend growth indicates a slight negative trend over recent years, impacting overall attractiveness.
| Time | Growth |
|---|---|
| 3 years | -4.70 % |
| 5 years | -2.09 % |
The average dividend growth is -2.09 % over 5 years. This shows moderate but steady dividend adjustments.
🗣️ Payout Ratio
The payout ratios offer insights into potential sustainability challenges, impacting future dividend distributions.
| Key Figure | Ratio |
|---|---|
| EPS-based | 28.25 % |
| Free Cash Flow-based | 45.77 % |
The EPS payout ratio at 28.25 % and the FCF payout ratio at 45.77 % suggest a balanced approach to maintaining payout sustainability.
Cashflow & Capital Efficiency Analysis
Understanding these metrics points to Apollo's effective management of cash flows and capital, ultimately supporting dividend payments.
| Year | 2024 | 2023 | 2022 |
|---|---|---|---|
| Free Cash Flow Yield | 3.36 % | 11.67 % | 9.62 % |
| Earnings Yield | 4.57 % | 9.01 % | -5.26 % |
| CAPEX to Operating Cash Flow | 0.00 % | 0.00 % | 5.35 % |
| Stock-based Compensation to Revenue | 2.76 % | 3.14 % | 4.92 % |
| Free Cash Flow/Operating Cash Flow Ratio | 100.00 % | 100.00 % | 94.65 % |
The cash flow metrics robustly back the firm's ability to generate capital, supporting strategic dividends amidst fluctuating free cash flow yields.
Balance Sheet & Leverage Analysis
A close examination of Apollo's balance sheet reflects strategic debt management, desiring improvements in leverage for optimal financial health.
| Year | 2024 | 2023 | 2022 |
|---|---|---|---|
| Debt-to-Equity | 0.61 | 0.58 | 1.08 |
| Debt-to-Assets | 0.03 | 0.026 | 0.03 |
| Debt-to-Capital | 0.38 | 0.37 | 0.52 |
| Net Debt to EBITDA | -0.63 | -1.18 | 0.65 |
| Current Ratio | 0.80 | 0.82 | 0.73 |
| Quick Ratio | 0.80 | 0.82 | 0.73 |
| Financial Leverage | 21.90 | 22.32 | 38.74 |
The metrics display stable debt through strategic maneuvers, though requiring continued focus on enhancing leverage ratios and liquidity.
Fundamental Strength & Profitability
The firm's strong fundamentals underscore its capacity to sustain profitability and support dividend payments amidst challenging market conditions.
| Year | 2024 | 2023 | 2022 |
|---|---|---|---|
| Return on Equity | 25.65 % | 34.76 % | -29.53 % |
| Return on Assets | 1.17 % | 1.56 % | -0.76 % |
| Net Profit Margin | 16.95 % | 14.95 % | -17.88 % |
| EBIT Margin | 29.77 % | 17.90 % | -36.70 % |
| EBITDA Margin | 33.88 % | 20.36 % | -31.87 % |
| Gross Margin | 95.63 % | 96.85 % | 91.55 % |
| Research & Development to Revenue | 0.00 % | 0.00 % | 0.00 % |
ROE and ROA suggest sound profit generation, notwithstanding episodic downturns, necessitating marginal improvement in profitability stability.
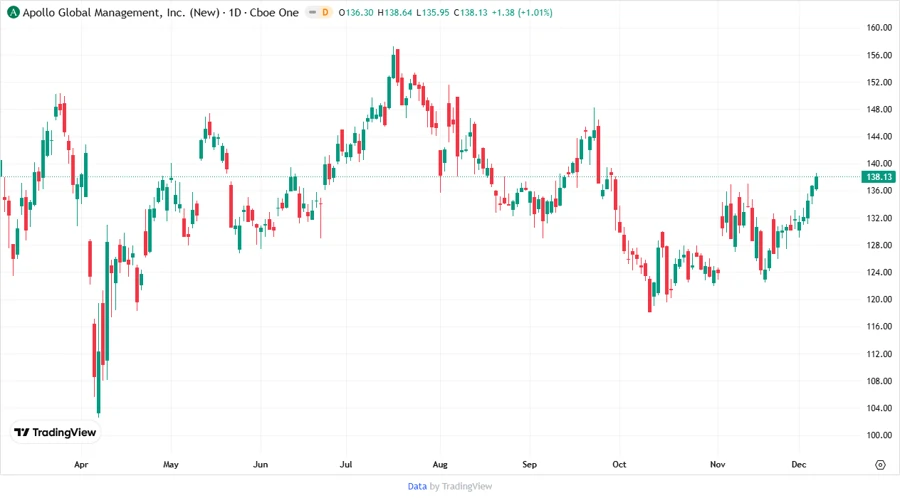
📈 Price Development
Dividend Scoring System
| Criteria | Score (1-5) | Visual |
|---|---|---|
| Dividend Yield | 3 | |
| Dividend Stability | 2 | |
| Dividend Growth | 2 | |
| Payout Ratio | 4 | |
| Financial Stability | 3 | |
| Dividend Continuity | 3 | |
| Cashflow Coverage | 4 | |
| Balance Sheet Quality | 3 |
Overall Score: 24/40
⚠️ Rating
Overall, Apollo Global Management's dividend outlook reflects mixed strength with a moderate yield and robust payout stability, yet challenges exist within growth and stability, warranting a cautious yet hopeful stance.