August 08, 2025 a 12:46 pm


APO: Dividend Analysis - Apollo Global Management, Inc.
Apollo Global Management, Inc. (APO) presents a modest dividend yield of 1.38%, reflecting a stable dividend history over the past 15 years. Though facing challenges in recent growth, the company maintains a healthy payout ratio, which showcases prudent management. Investors should consider these factors along with the firm's cash flow metrics as it navigates the current economic landscape.
📊 Overview
A comprehensive assessment of Apollo Global Management, Inc.'s dividend profile reveals its position in the Finance sector with a dividend yield of 1.38%. Its current dividend per share stands at $2.03, maintaining a steady distribution track record for 15 years, with no recent cuts or suspensions.
| Metric | Details |
|---|---|
| Sector | Finance |
| Dividend yield | 1.38% |
| Current dividend per share | 2.03 USD |
| Dividend history | 15 years |
| Last cut or suspension | None |
📈 Dividend History
The historical payment of dividends is vital as it demonstrates the consistent return to shareholders and can often indicate financial health and management's commitment to rewarding investors.
| Year | Dividend per Share (USD) |
|---|---|
| 2025 | 1.4825 |
| 2024 | 1.8175 |
| 2023 | 1.69 |
| 2022 | 1.6 |
| 2021 | 2.1 |
⚠️ Dividend Growth
Although recent data shows a slight contraction, the compound growth rates over three and five years reflect management's ability to adapt and maintain payouts across economic cycles.
| Time | Growth |
|---|---|
| 3 years | -4.70% |
| 5 years | -2.09% |
The average dividend growth is -2.09% over 5 years. This shows a decline, raising caution among potential investors.
✅ Payout Ratio
The significance of payout ratios cannot be understated as it indicates the sustainability of dividend payments in relation to earnings and cash flow.
| Key figure | Ratio |
|---|---|
| EPS-based | 35.35% |
| Free cash flow-based | 28.66% |
With a 35.35% EPS-based payout and a 28.66% FCF-based payout, Apollo exhibits a strong commitment to maintaining sustainable dividend levels.
📊 Cashflow & Capital Efficiency
Understanding the cash flow dynamics is essential for gauging the financial flexibility of a company as it relates to operations and capital expenditure management.
| Year | 2024 | 2023 | 2022 |
|---|---|---|---|
| Free Cash Flow Yield | 3.36% | 11.68% | 9.62% |
| Earnings Yield | 4.73% | 9.32% | -5.26% |
| CAPEX to Operating Cash Flow | 0.00% | 0.00% | 5.35% |
| Stock-based Compensation to Revenue | 2.76% | 3.14% | 4.92% |
| Free Cash Flow / Operating Cash Flow Ratio | 100% | 100% | 94.65% |
| Return on Invested Capital | 6.57% | 7.38% | -34.42% |
The cash flow ratios highlight Apollo's resilience in the financial markets, strengthening its capacity for efficient capital allocation.
📊 Balance Sheet & Leverage Analysis
A scrutinized review of balance sheet ratios gives insight into financial leverage and liquidity, impacting future growth potential and risk profile.
| Year | 2024 | 2023 | 2022 |
|---|---|---|---|
| Debt-to-Equity | 0.61 | 0.58 | 1.91 |
| Debt-to-Assets | 0.03 | 0.03 | 0.26 |
| Net Debt to EBITDA | -0.63 | -1.18 | -0.63 |
| Debt-to-Capital | 0.38 | 0.37 | 0.66 |
| Current Ratio | 0.80 | 0.82 | 0.93 |
| Quick Ratio | 0.80 | 0.82 | -4.69 |
| Financial Leverage | 21.90 | 22.32 | 7.46 |
Apollo's balance sheet depicts moderate leverage levels with stability in asset management and liabilities.
📊 Fundamental Strength & Profitability
The analysis of profitability margins and returns showcases the operational excellence and performance efficacy, crucial for long-term value creation.
| Year | 2024 | 2023 | 2022 |
|---|---|---|---|
| Return on Equity | 26.53% | 35.94% | -106.10% |
| Return on Assets | 1.21% | 1.61% | -14.22% |
| Net Margin | 17.53% | 15.46% | -17.88% |
| EBIT Margin | 29.77% | 17.90% | -36.70% |
| EBITDA Margin | 33.89% | 20.36% | -31.87% |
| Gross Margin | 95.63% | 96.85% | 91.55% |
| Research & Development to Revenue | N/A | N/A | N/A |
Examining profitability metrics affirms Apollo's robust operational framework despite minor setbacks in recent fiscal years.
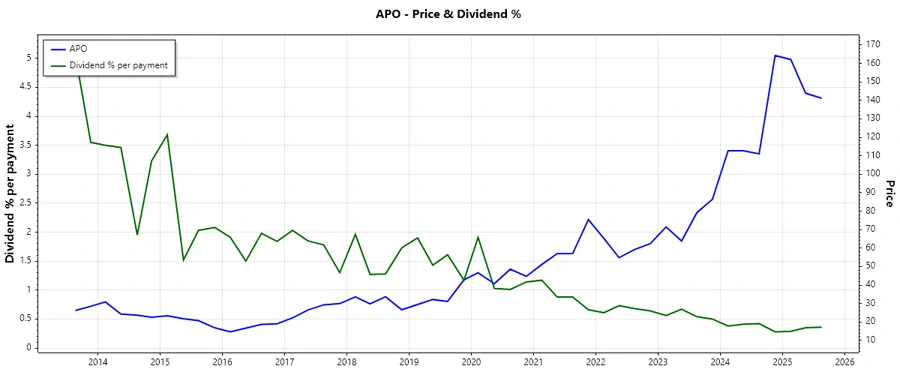
📈 Price Development
🗣️ Dividend Scoring System
| Criterion | Score | Visual Indicator |
|---|---|---|
| Dividend yield | 2 | |
| Dividend Stability | 4 | |
| Dividend growth | 1 | |
| Payout ratio | 5 | |
| Financial stability | 3 | |
| Dividend continuity | 5 | |
| Cashflow Coverage | 3 | |
| Balance Sheet Quality | 4 |
Overall Score: 27/40
🗣️ Rating
Based on current analysis, Apollo Global Management, Inc. demonstrates a well-managed dividend policy with sustainability. However, caution is advised given the recent decline in growth rate. For those valuing income stability over growth, the current dividend policy remains attractive.
Smart Data Insight
Master the Perfect Entry & Exit for this Stock
Don't leave your profits to chance. Historically, this stock follows specific seasonal patterns that institutional traders use to maximize returns.
- ✅ Identify the "Golden Buying Window"
- ✅ Avoid high-risk correction cycles
- ✅ Backtested data from the last 20+ years