June 14, 2025 a 07:46 am
APO: Dividend Analysis - Apollo Global Management, Inc.
Despite challenges in recent years, Apollo Global Management continues to showcase notable dividend metrics. Its stable dividend history and cautious payout ratios indicate robust financial health. However, recent growth in dividend payouts has been slightly negative, suggesting potential caution regarding future increases.
📊 Overview
| Attribute | Details |
|---|---|
| Sector | Financials |
| Dividend yield | 1.32 % |
| Current dividend per share | 2.03 USD |
| Dividend history | 15 years |
| Last cut or suspension | None |
🗣️ Dividend History
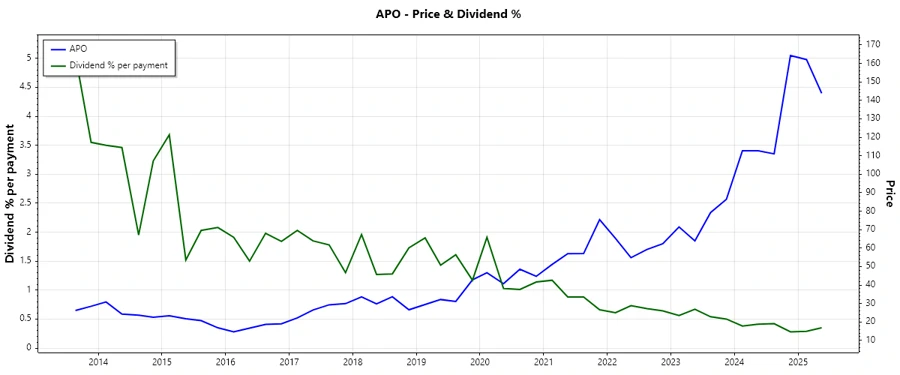
Apollo Global Management has maintained a consistent dividend payment over the years. This stability underscores the company's commitment to shareholder returns. A steady dividend history enhances investor confidence, particularly for income-seeking shareholders.
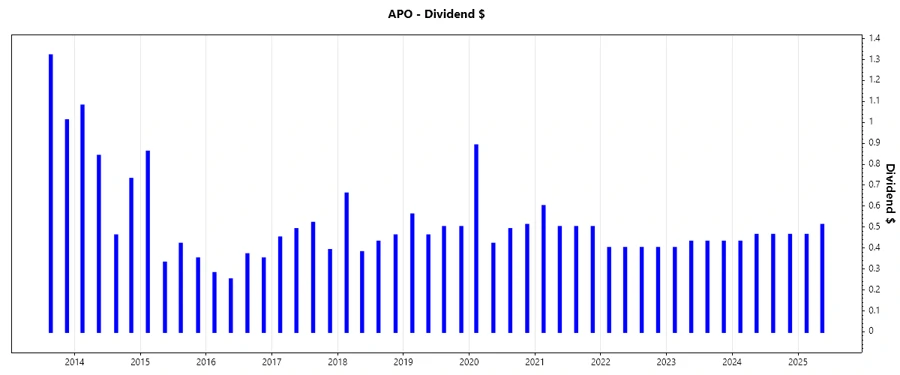
| Year | Dividend Per Share (USD) |
|---|---|
| 2025 | 0.9725 |
| 2024 | 1.8175 |
| 2023 | 1.69 |
| 2022 | 1.6 |
| 2021 | 2.1 |
📈 Dividend Growth
The dividend growth of Apollo Global Management in the past few years shows a decline. Despite negative growth, the company's historical yield signals a potential for stabilization in the future. Tracking dividend growth can indicate financial strength and management's confidence.
| Time | Growth |
|---|---|
| 3 years | -4.70 % |
| 5 years | -2.09 % |
The average dividend growth is -2.09 % over 5 years. This shows moderate but steady dividend growth.
⚠️ Payout Ratio
Payout ratios provide a key insight into whether a company retains enough of its earnings to manage operations and investments. Balanced payout ratios reflect Apollo's prudent financial management.
| Key figure | Ratio |
|---|---|
| EPS-based | 33.17 % |
| Free cash flow-based | 32.63 % |
The EPS and FCF payout ratios indicate a conservative approach to dividend payments, ensuring sufficient reinvestment into the business while also rewarding shareholders.
✅ Cashflow & Capital Efficiency
Analyzing cash flow and capital efficiency reveals the company's operational efficacy and cash sufficiency. APOLLO showcases resilience with consistent free cash flow and strong yield metrics, hinting at high liquidity and operational prowess.
| 2024 | 2023 | 2022 | |
|---|---|---|---|
| Free Cash Flow Yield | 3.36 % | 11.68 % | 9.62 % |
| Earnings Yield | 4.73 % | 9.32 % | -5.26 % |
| CAPEX to Operating Cash Flow | 0 % | 0 % | 5.35 % |
| Stock-based Compensation to Revenue | 2.76 % | 3.14 % | 4.92 % |
| Free Cash Flow / Operating Cash Flow Ratio | 1 | 1 | 0.95 |
Apollo's positive cash flow and efficient capital allocation suggest robust operational management, favorable for future strategic investments.
🧮 Balance Sheet & Leverage Analysis
The balance sheet provides insights into financial stability and leverage. Apollo's metrics here highlight a favorable debt profile and manageable financial leverage.
| 2024 | 2023 | 2022 | |
|---|---|---|---|
| Debt-to-Equity | 61.37 % | 57.62 % | 190.91 % |
| Debt-to-Assets | 2.80 % | 2.58 % | 25.58 % |
| Debt-to-Capital | 38.03 % | 36.56 % | 65.62 % |
| Net Debt to EBITDA | -0.66 | -0.86 | -1.31 |
| Current Ratio | 0.80 | 0.82 | 0.93 |
| Quick Ratio | 0.80 | 0.82 | -4.69 |
| Financial Leverage | 21.90 | 22.32 | 7.46 |
Apollo's leverage ratios are generally in the moderate range, indicating good financial stability and potential for debt management.
🔍 Fundamental Strength & Profitability
Fundamentals measure profitability and operational performance. Apollo's figures suggest robust profitability margins and consistent returns on assets and equity.
| 2024 | 2023 | 2022 | |
|---|---|---|---|
| Return on Equity | 26.53 % | 35.94 % | -106.10 % |
| Return on Assets | 1.21 % | 1.61 % | -14.22 % |
| Margins: Net | 17.53 % | 15.46 % | -17.88 % |
| EBIT Margin | 29.77 % | 17.90 % | -36.70 % |
| EBITDA Margin | 32.20 % | 27.94 % | -15.39 % |
| Gross Margin | 90.01 % | 96.85 % | 91.55 % |
| R&D to Revenue | 0 % | 0 % | 0 % |
Strong profitability and operating margins highlight Apollo's robust earning capabilities, suggesting strong shareholder value over time.
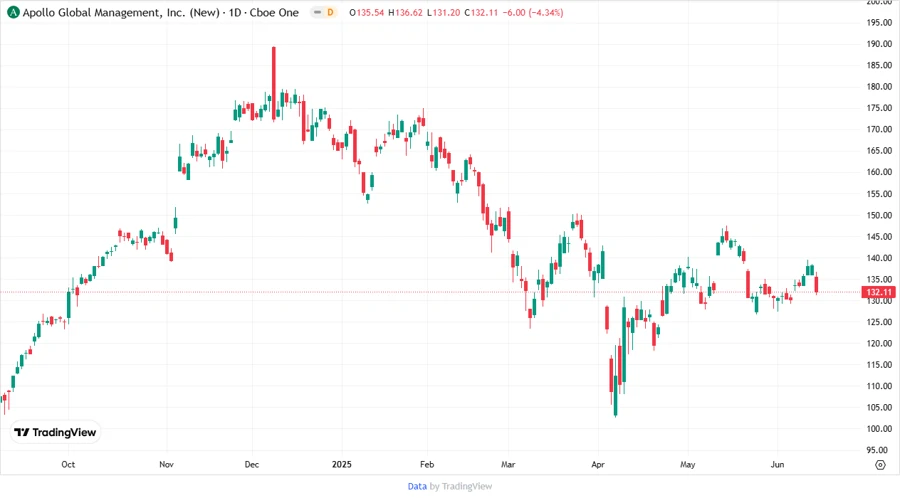
📉 Price Development
📝 Dividend Scoring System
| Criteria | Score | Bar |
|---|---|---|
| Dividend yield | 3 | |
| Dividend Stability | 4 | |
| Dividend growth | 2 | |
| Payout ratio | 4 | |
| Financial stability | 3 | |
| Dividend continuity | 5 | |
| Cashflow Coverage | 4 | |
| Balance Sheet Quality | 3 |
Total Score: 28/40
⭐ Rating
Apollo Global Management, Inc. presents a mixed dividend profile, balancing steady payouts with constrained growth. While certain challenges remain, particularly in terms of leverage and dividend growth, continuous dividend payments over 15 years underscore a commitment to shareholder returns. Investors looking for moderate returns with some risk may find Apollo appealing.
Smart Data Insight
Master the Perfect Entry & Exit for this Stock
Don't leave your profits to chance. Historically, this stock follows specific seasonal patterns that institutional traders use to maximize returns.
- ✅ Identify the "Golden Buying Window"
- ✅ Avoid high-risk correction cycles
- ✅ Backtested data from the last 20+ years