May 11, 2026 a 03:31 pm

APH: Dividend Analysis - Amphenol Corporation
Amphenol Corporation demonstrates a stable dividend track record with 22 consecutive years of payouts. Despite a relatively low dividend yield of 0.732%, the company showcases potential for steady growth given its manageable payout ratios. As we delve deeper, we'll examine the fundamental strength and financial stability supporting Amphenol’s ongoing shareholder value return.
📊 Overview
Amphenol Corporation operates within the electronic components sector. The company's dividend yield stands at 0.732%, a current dividend per share of 0.659 USD, with a resilient 22-year dividend history and no recent cuts or suspensions, indicating potential for consistent performance.
| Metric | Details |
|---|---|
| Sector | Electronic Components |
| Dividend yield | 0.73% |
| Current dividend per share | 0.659 USD |
| Dividend history | 22 years |
| Last cut or suspension | None |
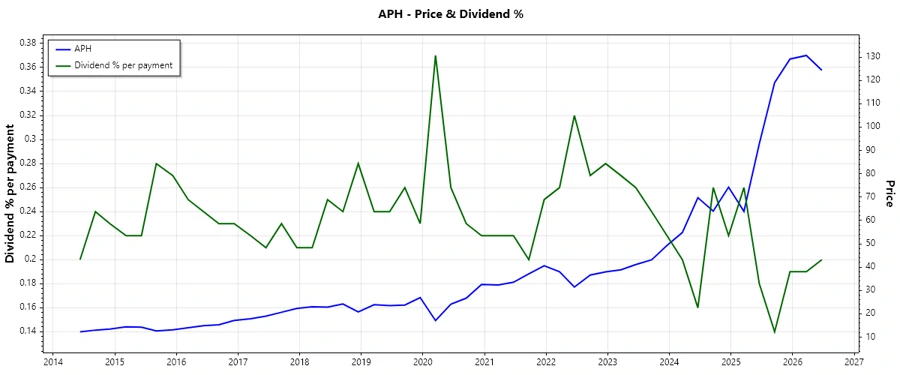
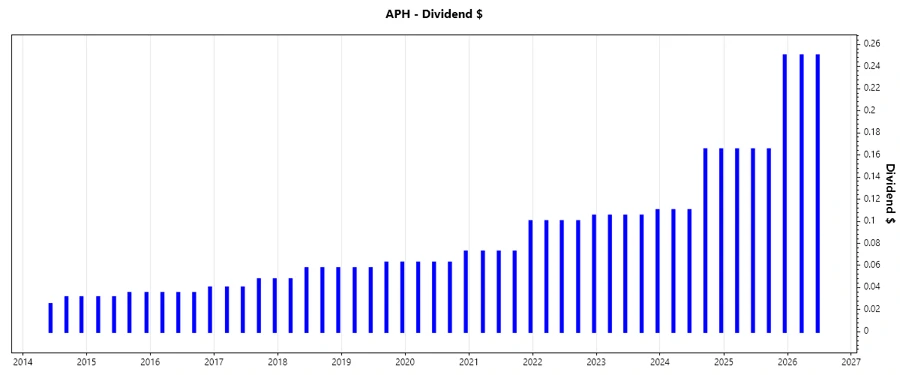
📈 Dividend History
The historical trend of increasing dividends reflects the company's robust earnings power and commitment to returning profits to shareholders. This reinforces investor confidence, essential for long-term capital appreciation.
| Year | Dividend per Share (USD) |
|---|---|
| 2026 | 0.50 |
| 2025 | 0.745 |
| 2024 | 0.550 |
| 2023 | 0.425 |
| 2022 | 0.405 |
🗣️ Dividend Growth
Understanding dividend growth is vital as it indicates not just the company's past profitability but also its future outlook. Growth metrics provide insight into potential future increases in payouts, driving long-term investment returns.
| Time | Growth (%) |
|---|---|
| 3 years | 22.53% |
| 5 years | 23.43% |
The average dividend growth is 23.43% over 5 years. This shows moderate but steady dividend growth.
✅ Payout Ratio
Payout ratios provide a snapshot of the dividend's sustainability. A lower ratio indicates more cash is available for reinvestment and debt repayment, ensuring financial health.
| Key figure | Ratio (%) |
|---|---|
| EPS-based | 18.08% |
| Free cash flow-based | 17.49% |
The EPS-based payout ratio of 18.08% and FCF payout ratio of 17.49% are both favorable, indicating Amphenol’s dividends are well-covered by its earnings and cash flows.
⚠️ Cashflow & Capital Efficiency
Examining cash flow metrics is crucial for assessing a company's ability to maintain operations, invest for growth, and fulfill its financial obligations. It also provides insight into operational efficiency and resource allocation.
| Year | 2023 | 2024 | 2025 |
|---|---|---|---|
| Free Cash Flow Yield | 3.65% | 2.57% | 2.66% |
| Earnings Yield | 3.26% | 2.89% | 2.59% |
| CAPEX to Operating Cash Flow | 14.74% | 23.64% | 18.54% |
| Stock-based Compensation to Revenue | 0.79% | 0.72% | 0% |
| Free Cash Flow / Operating Cash Flow Ratio | 85.26% | 76.36% | 81.46% |
Amphenol exhibits a stable cash flow with efficient capital allocation, illustrated by a healthy free cash flow to operating cash flow ratio across three years.
📉 Balance Sheet & Leverage Analysis
Balance sheet analysis uncovers the company’s leverage and financial health. Strong metrics indicate lower risk and sustainable growth potential.
| Year | 2023 | 2024 | 2025 |
|---|---|---|---|
| Debt-to-Equity | 0.556 | 0.743 | 1.156 |
| Debt-to-Assets | 0.281 | 0.340 | 0.428 |
| Debt-to-Capital | 0.357 | 0.426 | 0.536 |
| Net Debt to EBITDA | 1.055 | 1.043 | 0.634 |
| Current Ratio | 2.168 | 2.372 | 2.979 |
| Quick Ratio | 1.481 | 1.748 | 2.476 |
| Financial Leverage | 1.980 | 2.190 | 2.702 |
Amphenol's balance sheet metrics show financial robustness with moderate leverage levels, providing the company flexibility in capital management.
🔥 Fundamental Strength & Profitability
Scrutinizing these metrics offers insight into the company's operational success, return efficiency, and profitability, pivotal for long-term growth.
| Year | 2023 | 2024 | 2025 |
|---|---|---|---|
| Return on Equity | 23.10% | 24.75% | 31.84% |
| Return on Assets | 11.67% | 11.31% | 11.78% |
| Margins: Net | 15.36% | 15.92% | 18.49% |
| Margins: EBIT | 20.66% | 21.21% | 25.84% |
| Margins: EBITDA | 23.90% | 24.97% | 29.84% |
| Margins: Gross | 32.53% | 33.76% | 36.88% |
| Research & Development to Revenue | 2.73% | 2.98% | 0% |
With strong profit margins and returns, Amphenol underscores its operational efficiency and competitive standing, supporting its dividend capabilities.
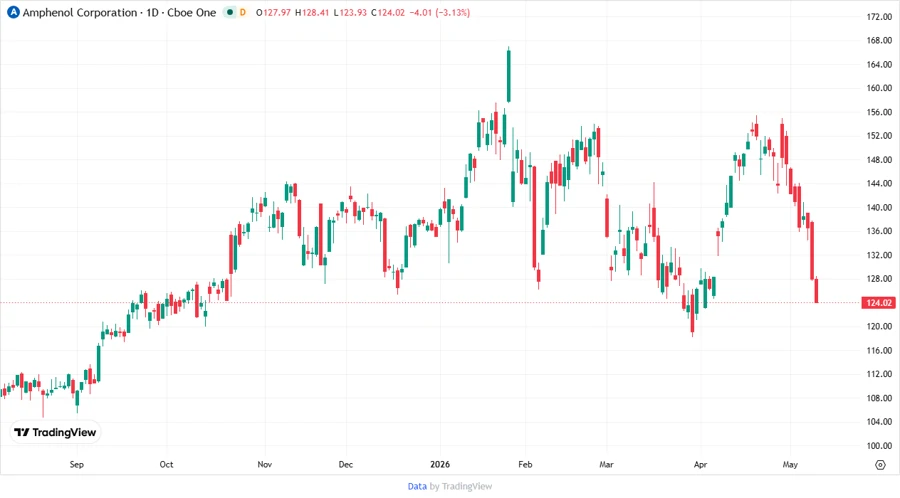
📈 Price Development
🔍 Dividend Scoring System
| Criteria | Score (1-5) | Score Bar |
|---|---|---|
| Dividend yield | 2 | |
| Dividend Stability | 4 | |
| Dividend growth | 4 | |
| Payout ratio | 5 | |
| Financial stability | 4 | |
| Dividend continuity | 4 | |
| Cashflow Coverage | 4 | |
| Balance Sheet Quality | 5 |
Total Score: 32/40
🌟 Rating
Amphenol Corporation is rated as a strong dividend play with consistent payout history and solid financial foundations. Despite a lower yield, its growth potential, efficient payout management, and financial strength pose a reliable opportunity for income-focused investors.
Smart Data Insight
Master the Perfect Entry & Exit for this Stock
Don't leave your profits to chance. Historically, this stock follows specific seasonal patterns that institutional traders use to maximize returns.
- ✅ Identify the "Golden Buying Window"
- ✅ Avoid high-risk correction cycles
- ✅ Backtested data from the last 20+ years