March 06, 2026 a 03:31 pm


APH: Dividend Analysis - Amphenol Corporation
Amphenol Corporation demonstrates a robust dividend history with 22 years of consistent payouts. The company's impressive EPS and FCF-based payout ratios reflect a sustainable dividend policy, buoyed by moderate but steady growth. This reliability positions Amphenol favorably among income-focused investors.
📊 Overview
Amphenol Corporation is an established player in its sector, known for its consistent dividend payments stretching over 22 years, underlining its commitment to shareholder returns. This sector stability, combined with a dividend yield of 0.61%, provides a reliable income stream, albeit relatively modest in percentage terms.
| Metric | Details |
|---|---|
| Sector | Technology |
| Dividend Yield | 0.61% |
| Current Dividend per Share | $0.66 |
| Dividend History | 22 years |
| Last Cut or Suspension | None |
📈 Dividend History
Amphenol Corporation's historical dividend payout is a testament to its financial strength, ensuring steady income to investors. Understanding past dividend actions helps forecast future stability and policy shifts.
| Year | Dividend per share (USD) |
|---|---|
| 2026 | $0.25 |
| 2025 | $0.75 |
| 2024 | $0.55 |
| 2023 | $0.43 |
| 2022 | $0.41 |
📊 Dividend Growth
Amphenol Corporation showcases a steady growth in dividends over the past few years, a critical element for gauging long-term investment value. This trend suggests a commitment to enhancing shareholder value through increased future payouts.
| Time | Growth |
|---|---|
| 3 years | 0.23% |
| 5 years | 0.23% |
The average dividend growth is 0.23% over 5 years. This shows moderate but steady dividend growth.
📊 Payout Ratio
The payout ratios of Amphenol Corporation, especially EPS and FCF-based, reveal a conservative approach to dividend distributions, preserving earnings for reinvestment while maintaining attractive shareholder returns.
| Key figure | Ratio |
|---|---|
| EPS-based | 18.90% |
| Free cash flow-based | 18.49% |
With an EPS payout ratio of 18.90% and FCF payout ratio of 18.49%, Amphenol ensures a prudent balance between rewarding shareholders and retaining funds for strategic growth.
📊 Cashflow & Capital Efficiency
Evaluating Amphenol Corporation's free cash flow yield and capital efficiency metrics indicates the firm's ability to generate and effectively utilize cash, fostering operational flexibility and strategic initiatives.
| Metric | 2025 | 2024 | 2023 |
|---|---|---|---|
| Free Cash Flow Yield | 2.66% | 2.57% | 3.65% |
| Earnings Yield | 2.61% | 2.90% | 3.26% |
| CAPEX/Operating Cash Flow | 18.54% | 23.64% | 14.74% |
| Stock-based Compensation/Revenue | 0% | 0.72% | 0.79% |
| Free Cash Flow/Operating Cash Flow Ratio | 81.46% | 76.36% | 85.26% |
Amphenol's cash flow metrics denote a healthy cash generation capacity, with strong returns on capital investments ensuring long-term operational efficacy and profitability.
📊 Balance Sheet & Leverage Analysis
Amphenol Corporation's balance sheet values emphasize financial health, highlighting low leverage and substantial liquidity to meet obligations and expand through potential strategic acquisitions.
| Metric | 2025 | 2024 | 2023 |
|---|---|---|---|
| Debt-to-Equity | 1.16 | 0.74 | 0.56 |
| Debt-to-Assets | 0.43 | 0.34 | 0.28 |
| Debt-to-Capital | 0.54 | 0.43 | 0.36 |
| Net Debt to EBITDA | 0.63 | 1.04 | 1.06 |
| Current Ratio | 2.98 | 0 | 2.17 |
| Quick Ratio | 2.48 | 1.75 | 1.48 |
| Financial Leverage | 2.70 | 2.19 | 1.98 |
The balance sheet metrics indicate that Amphenol maintains an optimal capital structure, enhancing its ability to scale operations and fund new investments while assuring debt coverage and financial stability.
📊 Fundamental Strength & Profitability
Amphenol Corporation's fundamental strengths, marked by solid profitability ratios, drive its competitive advantage in the market, contributing to shareholder value through sustained earnings and efficient operations.
| Metric | 2025 | 2024 | 2023 |
|---|---|---|---|
| Return on Equity | 35.77% | 24.75% | 23.10% |
| Return on Assets | 11.78% | 11.31% | 11.67% |
| Margins: Net | 18.49% | 15.92% | 15.36% |
| EBIT Margin | 25.84% | 21.21% | 20.66% |
| EBITDA Margin | 29.84% | 24.97% | 23.90% |
| Gross Margin | 36.88% | 33.76% | 32.53% |
| R&D/Revenue | 0% | 2.98% | 2.73% |
Amphenol's consistently high return ratios and robust margins highlight its operational excellence, enabling it to capitalize on market opportunities efficiently while protecting profit margins.
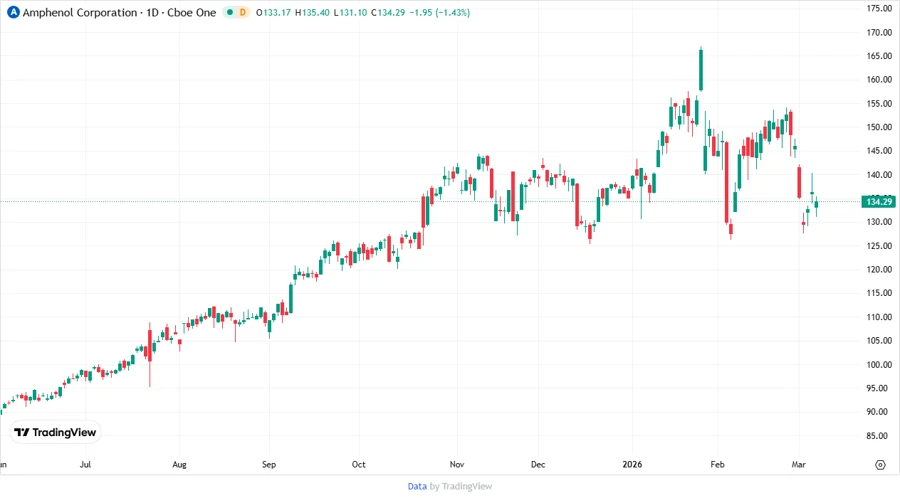
📊 Price Development
📊 Dividend Scoring System
| Category | Rating | Score |
|---|---|---|
| Dividend Yield | 3 | |
| Dividend Stability | 5 | |
| Dividend Growth | 3 | |
| Payout Ratio | 4 | |
| Financial Stability | 4 | |
| Dividend Continuity | 5 | |
| Cashflow Coverage | 4 | |
| Balance Sheet Quality | 5 |
Overall Score: 33/40
📊 Rating
Based on the comprehensive analysis, Amphenol Corporation maintains a strong position as a dividend-paying entity. Recommendations suggest a cautious continuation for current investors and a consideration for potential investors looking for steady dividend growth intertwined with a historically solid balance sheet.