July 07, 2025 a 02:46 am


APH: Dividend Analysis - Amphenol Corporation
Amphenol Corporation presents a compelling investment scenario with a robust historical dividend profile. With a consistent dividend history spanning over two decades, the company's disciplined approach to cash distributions signifies a reliable income stream for investors. It boasts a strong commitment to shareholder returns, as reflected by their steadily growing dividends, even amidst cyclical market challenges.
Overview 📊
Amphenol Corporation operates in the technology sector and exhibits a moderate yet stable dividend yield. Despite its relatively lower yield of 0.71%, the consistent annual payments over 21 years underscore its reliability as a dividend payer. The firm has reported no dividend cuts or suspensions, reinforcing its resilience in maintaining shareholder returns.
| Criteria | Details |
|---|---|
| Sector | Technology |
| Dividend yield | 0.71 % |
| Current dividend per share | 0.49 USD |
| Dividend history | 21 years |
| Last cut or suspension | None |
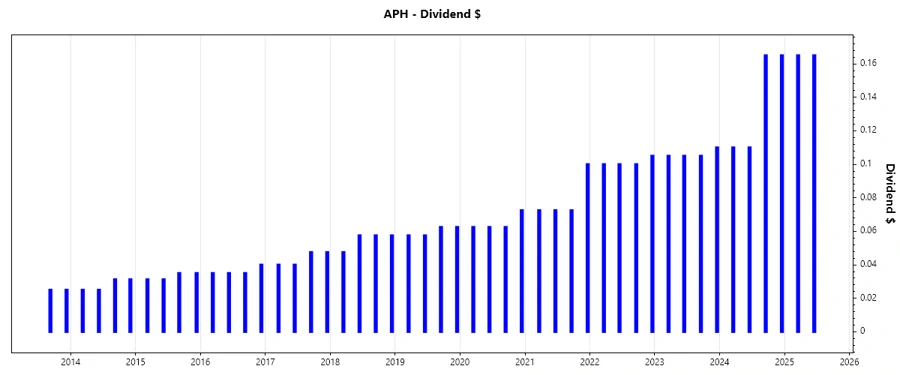
Dividend History 📈
The importance of understanding dividend history lies in assessing the reliability and consistency of cash flows to investors. Amphenol's continuous dividend payments for 21 years reflect its operational stability and commitment to returning profits to shareholders.
| Year | Dividend per Share (USD) |
|---|---|
| 2025 | 0.33 |
| 2024 | 0.55 |
| 2023 | 0.43 |
| 2022 | 0.41 |
| 2021 | 0.32 |
Dividend Growth 🚀
An analysis of dividend growth uncovers the company's capability to enhance shareholder value over time. A growth of 20.10% over 3 years and 18.04% over 5 years illustrates Amphenol's successful dividend expansion strategy, which reinforces its potential as a rewarding investment.
| Time | Growth |
|---|---|
| 3 years | 20.10 % |
| 5 years | 18.04 % |
The average dividend growth is 18.04% over 5 years. This shows moderate but steady dividend growth.
Payout Ratio 💰
Payout ratios are pivotal in evaluating how well a company's earnings can sustain dividend payouts. With an EPS-based payout ratio of 22.89% and a free cash flow-based ratio of 26.90%, Amphenol maintains ample cushion to support and potentially increase its dividend, while preserving financial stability.
| Key figure | Ratio |
|---|---|
| EPS-based | 22.89 % |
| Free cash flow-based | 26.90 % |
Both ratios are well within the sustainable range, suggesting a balanced approach towards dividends and retained profits for growth opportunities.
Cashflow & Capital Efficiency 💸
Assessing cash flow metrics such as free cash flow yield and capital efficiency provides insight into financial health and operational effectiveness. Amphenol's free cash flow yield and earnings yield highlight its capability to generate cash efficiently, which is fundamental for covering dividend payments and financing growth.
| Metric | 2024 | 2023 | 2022 |
|---|---|---|---|
| Free Cash Flow Yield | 2.57% | 3.65% | 3.94% |
| Earnings Yield | 2.90% | 3.26% | 4.19% |
| CAPEX to Operating Cash Flow | N/A | 14.74% | 17.65% |
| Stock-based Compensation to Revenue | N/A | 0.79% | 0.71% |
| Free Cash Flow / Operating Cash Flow Ratio | 76.36% | 85.26% | 82.35% |
These indicators suggest that Amphenol maintains efficient cash generation capabilities, bolstering its capacity to fund dividends while investing in future growth.
Balance Sheet & Leverage Analysis 🏦
The balance sheet's leverage ratios are critical for understanding financial stability and risk. Amphenol's moderate leverage ratios reflect a prudent balance between debt and equity, ensuring financial flexibility and sound liquidity for sustaining operations and potential investments.
| Metric | 2024 | 2023 | 2022 |
|---|---|---|---|
| Debt-to-Equity | 70.32% | 51.97% | 65.25% |
| Debt-to-Assets | 32.12% | 26.24% | 29.87% |
| Debt-to-Capital | 41.29% | 34.20% | 39.49% |
| Net Debt to EBITDA | 0.94 | 0.95 | 1.07 |
| Current Ratio | 2.37 | 2.17 | 2.42 |
| Quick Ratio | 1.75 | 1.48 | 1.64 |
| Financial Leverage | 2.19 | 1.98 | 2.18 |
These metrics illustrate a conservative financial strategy that ensures ample liquidity for operational needs and enhances resilience against economic fluctuations.
Fundamental Strength & Profitability 📊
Amphenol's profitability metrics, such as return on equity and margins, provide insights into operational efficiency and market positioning. The company maintains healthy profit margins, supporting the notion of strong competitive standing and efficient resource utilization.
| Metric | 2024 | 2023 | 2022 |
|---|---|---|---|
| Return on Equity | 24.75% | 23.10% | 27.12% |
| Return on Assets | 11.31% | 11.67% | 12.41% |
| Net Margin | 15.92% | 15.36% | 15.07% |
| EBIT Margin | 21.21% | 20.66% | 20.56% |
| EBITDA Margin | 24.97% | 23.90% | 23.68% |
| Gross Margin | 33.76% | 32.53% | 31.91% |
| R&D to Revenue | N/A | 2.73% | 2.56% |
This profitability highlights operational expertise and robust returns on shareholder equity, favorably positioning the company for future growth and profit sustenance.
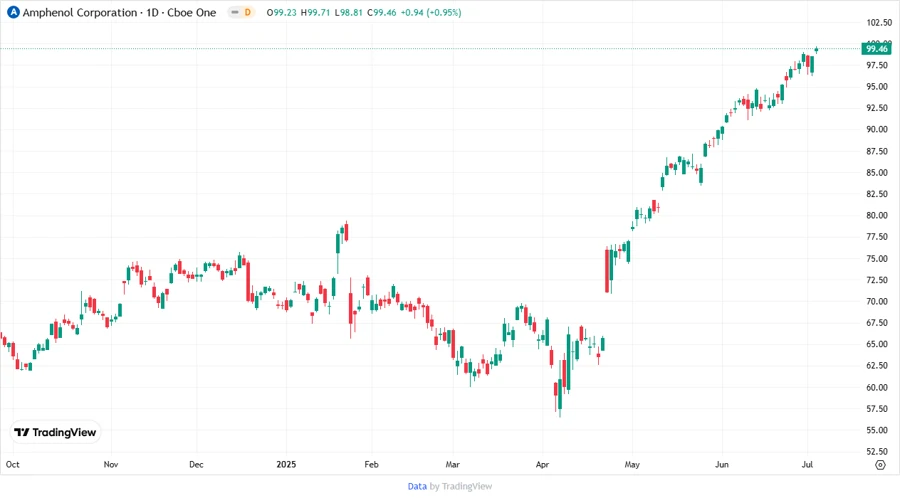
Price Development 📉
Dividend Scoring System 🏆
The effectiveness of a dividend scoring system lies in its ability to provide a holistic view of a firm's dividend policies and financial health. Each category is scored from 1 to 5, representing the strength in corresponding segments.
| Category | Score | |
|---|---|---|
| Dividend Yield | 3 | |
| Dividend Stability | 5 | |
| Dividend Growth | 4 | |
| Payout Ratio | 4 | |
| Financial Stability | 5 | |
| Dividend Continuity | 5 | |
| Cashflow Coverage | 4 | |
| Balance Sheet Quality | 5 |
Total Score: 35/40
Rating 🗣️
The analytical overview of Amphenol Corporation's dividend profile reflects a strong commitment to yielding significant shareholder returns through stable and growing dividends. The company showcases solid financial health, efficient cash flow management, and prudent capital allocation strategies. Through this assessment, we recommend Amphenol Corporation as a reliable investment for those seeking long-term, stable income generation and moderate capital gains.
Smart Data Insight
Master the Perfect Entry & Exit for this Stock
Don't leave your profits to chance. Historically, this stock follows specific seasonal patterns that institutional traders use to maximize returns.
- ✅ Identify the "Golden Buying Window"
- ✅ Avoid high-risk correction cycles
- ✅ Backtested data from the last 20+ years