
July 17, 2026 a 10:15 am
APD: Fibonacci Analysis - Air Products and Chemicals, Inc.
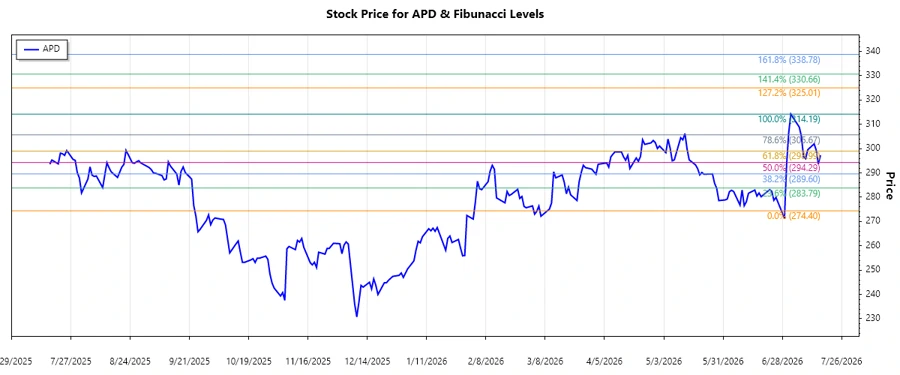
Air Products and Chemicals, Inc. (APD) has demonstrated a compelling upward trend in its stock movement from a low in early March 2026 to a substantial high in mid-July 2026. The company's strong performance in the supply of industrial gases and equipment globally has boosted investor confidence. APD's strategic initiatives and robust fundamentals position it as a potentially attractive investment. However, like any stock, it remains exposed to market volatilities.
Fibonacci Analysis
| Start Date | End Date | High Date | Low Date | High Price | Low Price |
|---|---|---|---|---|---|
| 2026-03-09 | 2026-07-16 | 2026-07-02 | 2026-03-09 | 314.19 | 274.4 |
| Fibonacci Level | Price Level |
|---|---|
| 0.236 | 283.64 |
| 0.382 | 291.36 |
| 0.5 | 294.30 |
| 0.618 | 298.23 |
| 0.786 | 306.23 |
The current price of 297.29 falls between the 0.5 and 0.618 Fibonacci levels, suggesting the price is within a potential retracement zone. This zone may act as a support, providing a springboard for further price advancements.
Technical Interpretation: The ongoing upward trajectory of APD, coupled with its position within the retracement zone, hints at robust support levels. This could point to additional gains or a period of consolidation before the next rise.
Conclusion
APD's stock performance indicates strong market positioning, evidenced by a clear upward trend and favorable retracement levels. Investors should consider potential support zones as indicative of sustained bullish sentiment. However, the volatile nature of stock markets underscores the importance of cautious and informed investment decisions. As an industry leader, APD's well-diversified operations could provide stability amid uncertain market conditions, although geopolitical factors and supply chain dynamics remain notable risks. Overall, the stock's technical indicators offer promising growth potential balanced with market responsiveness.
Smart Data Insight
Master the Perfect Entry & Exit for this Stock
Don't leave your profits to chance. Historically, this stock follows specific seasonal patterns that institutional traders use to maximize returns.
- ✅ Identify the "Golden Buying Window"
- ✅ Avoid high-risk correction cycles
- ✅ Backtested data from the last 20+ years