December 13, 2025 a 03:15 pm

APD: Fibonacci Analysis - Air Products and Chemicals, Inc.
Air Products and Chemicals, Inc. (APD) has been experiencing a notable downward trend over the past few months. The company, widely recognized for its production of atmospheric, process, and specialty gases, including equipment and services, is significant in industries like electronics and energy production. The stock has seen a high level of volatility, presenting challenges and potential opportunities for investors. It is crucial for stakeholders to closely monitor the upcoming market movements to capitalize on potential reversal or continuation patterns.
Fibonacci Analysis
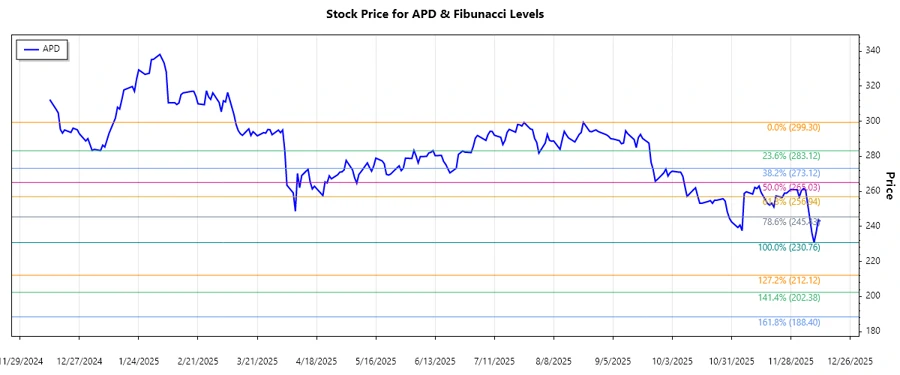
The analyzed trend for APD is a dominant downward trend. By identifying the high and low price points, we can calculate the Fibonacci retracement levels.
| Detail | Value |
|---|---|
| Trend Start Date | 2025-08-22 |
| Trend End Date | 2025-12-12 |
| Highest Price | $299.3 on 2025-08-22 |
| Lowest Price | $230.76 on 2025-12-09 |
| Current Price | $243 on 2025-12-12 |
| Fibonacci Level | Price Level |
|---|---|
| 0.236 | $253.79 |
| 0.382 | $263.33 |
| 0.5 | $265.03 |
| 0.618 | $278.88 |
| 0.786 | $290.12 |
The current price of APD is $243, which indicates that it is not in a retracement zone as per the calculated levels.
The technical interpretation suggests potential support can emerge at the $230.76 level, while $253.79 might act as an immediate resistance, should the price start climbing.
Conclusion
The recent analysis of APD's price action reveals a persistent downward trend, posing considerable risks for short-term investors. However, with careful observation of key retracement levels, long-term investors might identify potential entry points if a reversal pattern emerges. A break below the recent low might signal further declines, whereas recovery above the identified resistance points could indicate a bullish reversal. Ongoing monitoring of financial reports and industrial developments will be crucial for informed investment decisions.