
June 16, 2025 a 03:15 pm

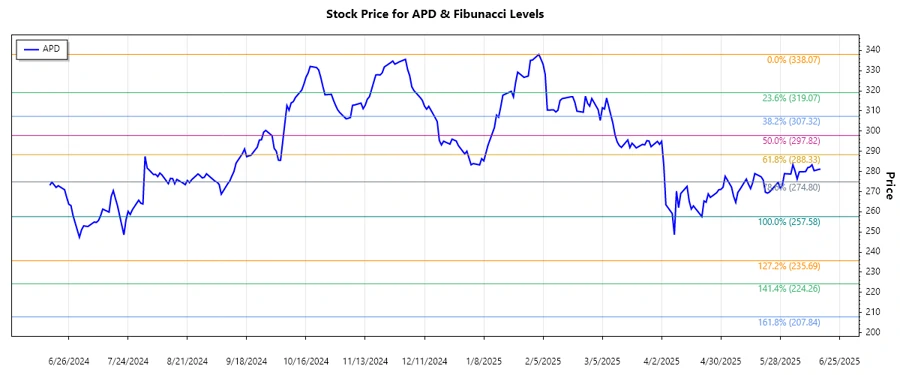
APD: Fibonacci Analysis - Air Products and Chemicals, Inc.
Air Products and Chemicals, Inc. has demonstrated resilience in the atmospheric and process gas industry, significantly impacting the chemical and gasification sectors worldwide. With a strategic collaboration with Baker Hughes Company, APD is strongly positioned to innovate in hydrogen compression systems. The recent stock trend analysis shows a pronounced downtrend, suggesting a cautiously optimistic outlook with potential support within Fibonacci levels.
Fibonacci Analysis
| Metric | Details |
|---|---|
| Trend Duration | 2025-02-03 to 2025-06-16 |
| High Price (Date) | $338.07 (2025-02-03) |
| Low Price (Date) | $257.58 (2025-04-21) |
| Current Price (Date) | $281.205 (2025-06-16) |
| Fibonacci Level | Price Level |
|---|---|
| 0.236 | $286.47 |
| 0.382 | $296.24 |
| 0.5 | $307.83 |
| 0.618 | $319.42 |
| 0.786 | $335.01 |
The current price is within the 0.236 Fibonacci retracement zone, suggesting potential support at this level. Analysts might view this as a consolidation phase, indicating a possible rebound if support holds.
Conclusion
The analysis of Air Products and Chemicals, Inc. indicates a dominant downtrend over the past few months. The stock currently trades within a critical Fibonacci retracement level, hinting at potential stabilization or reversal. While the downtrend suggests caution, the presence at the 0.236 level implies possible support. Investors should consider the strategic moves APD is making in hydrogen solutions while acknowledging the economic pressures influencing the gas industry. Monitoring these Fibonacci levels will be essential for anticipating future price movements and evaluating potential buy opportunities.
Smart Data Insight
Master the Perfect Entry & Exit for this Stock
Don't leave your profits to chance. Historically, this stock follows specific seasonal patterns that institutional traders use to maximize returns.
- ✅ Identify the "Golden Buying Window"
- ✅ Avoid high-risk correction cycles
- ✅ Backtested data from the last 20+ years