April 15, 2026 a 12:46 pm
APD: Dividend Analysis - Air Products and Chemicals, Inc.
Air Products and Chemicals, Inc., showcased a dividend yield of 2.48% which is relatively moderate, although the company has an impressive history with 44 years of dividend distribution. The dividend growth over the last 5 years indicates a steady albeit modest increase. However, attention is advised towards the payout ratios and cash flow dynamics, which reveal underlying challenges.
📊 Overview
The company operates in a diverse chemical sector, striving to maintain consistent dividend distributions. Here is a comprehensive overview:
| Key Metric | Value |
|---|---|
| Sector | Chemicals |
| Dividend Yield | 2.48% |
| Current Dividend Per Share | $7.11 |
| Dividend History | 44 years |
| Last Cut or Suspension | None |
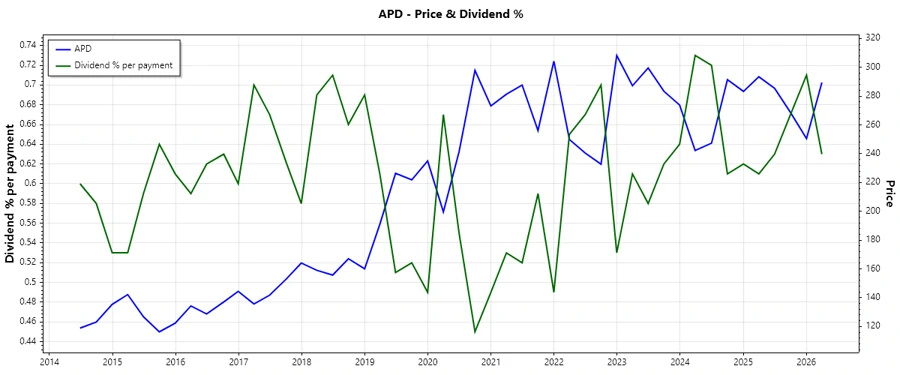
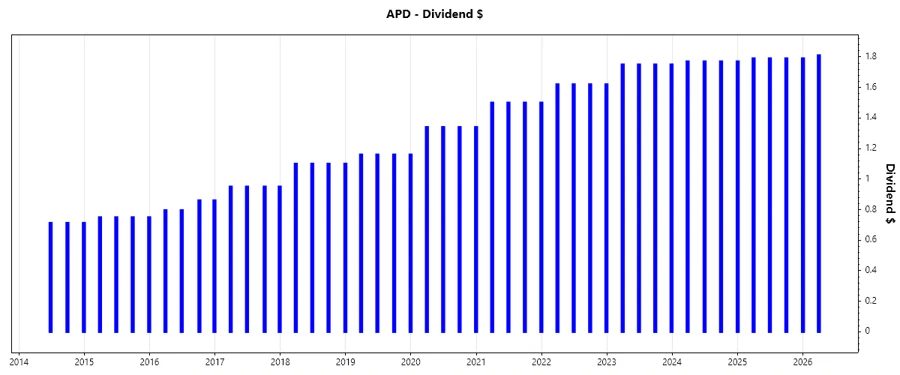
📉 Dividend History
The historical dividends underscore the company's commitment to returning value to shareholders, a crucial factor for income-seeking investors.
| Year | Dividend Per Share (USD) |
|---|---|
| 2026 | $3.60 |
| 2025 | $7.14 |
| 2024 | $5.31 |
| 2023 | $7.00 |
| 2022 | $6.48 |
📈 Dividend Growth
The growth rate is a reflective measure of a company's potential to increase dividends over time, which is key for long-term investors.
| Time | Growth |
|---|---|
| 3 years | 3.29% |
| 5 years | 5.90% |
The average dividend growth is 5.90% over 5 years. This shows moderate but steady dividend growth.
✅ Payout Ratio
The payout ratio is essential to judge the sustainability of dividends. Here are the relevant figures:
| Key Figure | Ratio |
|---|---|
| EPS-based | -474.71% |
| Free cash flow-based | -56.33% |
The extremely negative payout ratios suggest that the company is currently distributing more than it earns, specifically in terms of EPS-based metrics, which might raise sustainability concerns.
⚠️ Cashflow & Capital Efficiency
Evaluating the cash flow and capital efficiency is vital for understanding the financial robustness of the company. Here's the breakdown:
| Year | 2023 | 2024 | 2025 |
|---|---|---|---|
| Free Cash Flow Yield | -4.26% | -4.75% | -6.20% |
| CAPEX to Operating Cash Flow | 1.44 | 1.86 | 2.16 |
| Stock-based Compensation to Revenue | 0.48% | 0.51% | 0.63% |
| Free Cash Flow / Operating Cash Flow Ratio | -115.63% | -86.38% | -115.63% |
The data indicates strained cash flows can affect the company's ability to effectively reinvest and maintain its dividend commitments in the long term.
📋 Balance Sheet & Leverage Analysis
A crucial measure of financial health is the balance sheet which reveals the company's leverage and liquidity conditions.
| Year | 2023 | 2024 | 2025 |
|---|---|---|---|
| Debt-to-Equity | 0.77 | 0.88 | 1.23 |
| Debt-to-Assets | 0.34 | 0.38 | 0.45 |
| Net Debt to EBITDA | 2.13 | 1.85 | 12.11 |
| Current Ratio | 1.33 | 1.52 | 1.38 |
The increased leverage over time may signal higher risk if not managed correctly, potentially impacting dividend sustainability.
🗣️ Fundamental Strength & Profitability
This section focuses on the core profitability metrics and how they reflect on the company's operational efficiency and financial health.
| Year | 2023 | 2024 | 2025 |
|---|---|---|---|
| Return on Equity | 16.07% | 22.47% | -2.63% |
| Return on Assets | 7.18% | 9.67% | -0.96% |
| Net Margin | 18.26% | 31.64% | -3.28% |
| EBITDA Margin | 35.07% | 53.64% | 11.11% |
The fluctuating profitability metrics demonstrate varying operational efficiencies and signal areas that may affect future profit growth potential.
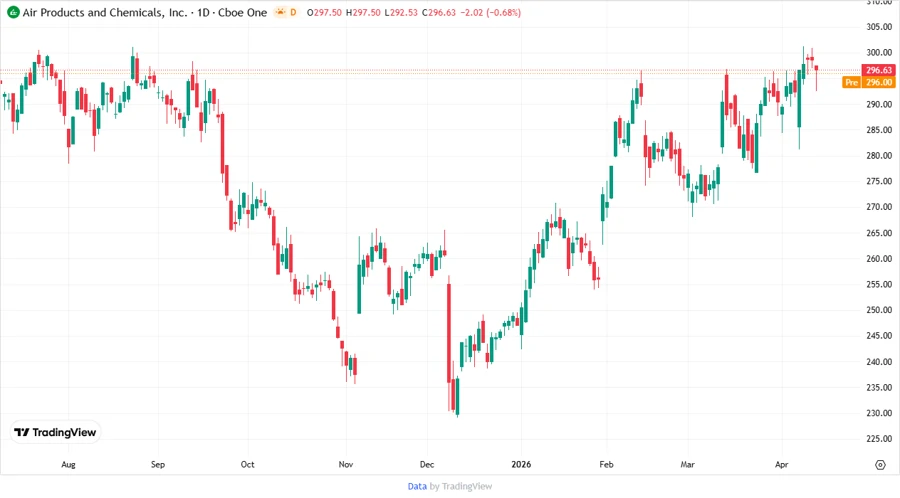
📈 Price Development
✅ Dividend Scoring System
| Category | Score | Bar |
|---|---|---|
| Dividend yield | 3 | |
| Dividend Stability | 4 | |
| Dividend Growth | 3 | |
| Payout Ratio | 1 | |
| Financial Stability | 2 | |
| Dividend Continuity | 5 | |
| Cashflow Coverage | 2 | |
| Balance Sheet Quality | 3 |
Total Score: 23/40
🗣️ Rating
In conclusion, Air Products and Chemicals, Inc. demonstrates a consistent dividend payout with decent stability and growth potential. However, financial concerns such as payout ratios and negative cash flow yields are noteworthy. As such, while suitable for income-focused portfolios, prospective investors should be cautious and monitor financial health closely for sustained future dividends.
Smart Data Insight
Master the Perfect Entry & Exit for this Stock
Don't leave your profits to chance. Historically, this stock follows specific seasonal patterns that institutional traders use to maximize returns.
- ✅ Identify the "Golden Buying Window"
- ✅ Avoid high-risk correction cycles
- ✅ Backtested data from the last 20+ years