November 13, 2025 a 03:31 am
APD: Dividend Analysis - Air Products and Chemicals, Inc.
Air Products and Chemicals, Inc. continues to exhibit resilience and commitment to its dividend strategy. Despite slight fluctuations in dividend growth, the company maintains a strong position within its sector. The latest financial ratios suggest careful management of resources, ensuring a focus on long-term shareholder value.
📊 Overview
This section provides an elemental overview of the company's dividend specifics, which remain crucial for evaluating the investment's stability.
| Parameter | Value |
|---|---|
| Sector | Basic Materials |
| Dividend yield | 2.65 % |
| Current dividend per share | 7.11 USD |
| Dividend history | 43 years |
| Last cut or suspension | 2024 |
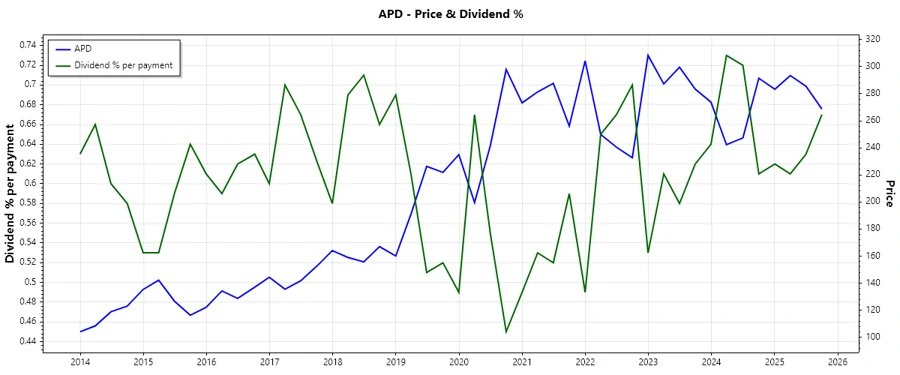
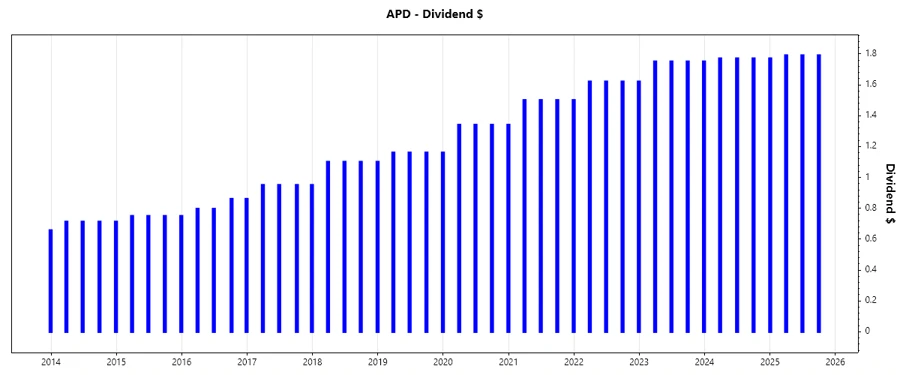
📈 Dividend History
Understanding the dividend history is essential for evaluating the consistency and reliability of cash returns to shareholders.
| Year | Dividend Per Share (USD) |
|---|---|
| 2025 | 7.14 |
| 2024 | 5.31 |
| 2023 | 7.00 |
| 2022 | 6.48 |
| 2021 | 6.00 |
📊 Dividend Growth
Analyzing dividend growth offers insights into the company's ability to increase shareholder returns over time.
| Time | Growth |
|---|---|
| 3 years | -3.99 % |
| 5 years | 2.73 % |
The average dividend growth is 2.73 % over 5 years. This shows moderate but steady dividend growth.
🗣️ Payout Ratio
The payout ratios provide an indication of the sustainability of dividends relative to profits and free cash flow.
| Key Figure | Ratio |
|---|---|
| EPS-based | -401.55 % |
| Free cash flow-based | -42.02 % |
The EPS-based payout ratio of -401.55 % and the FCF-based ratio of -42.02 % indicate potential concerns regarding dividend sustainability, often necessitating a deeper evaluation of income sources.
📊 Cashflow & Capital Efficiency
Evaluating cash flow and capital efficiency is crucial for understanding how well the company generates and utilizes cash.
| Year | 2023 | 2024 | 2025 |
|---|---|---|---|
| Free Cash Flow Yield | -2.25 % | -4.75 % | 5.36 % |
| Earnings Yield | 3.65 % | 5.78 % | -0.65 % |
| CAPEX to Operating Cash Flow | 1.44 | 1.86 | 0.00 |
| Stock-based Compensation to Revenue | 0.48 % | 0.51 % | 0.63 % |
| Free Cash Flow / Operating CF Ratio | -44.29% | -86.38% | 100% |
The fluctuation in Free Cash Flow Yield highlights volatility in operational cash management, while consistent stock-based compensation suggests ongoing investment in human capital. Such trends indicate careful but potentially risky financial maneuvering.
📊 Balance Sheet & Leverage Analysis
Analyses focused on the balance sheet and leverage provide insights into financial stability and risk exposure.
| Year | 2023 | 2024 | 2025 |
|---|---|---|---|
| Debt-to-Equity | 0.77 | 0.88 | 0.00 |
| Debt-to-Assets | 34.47 % | 37.92 % | 0.00 % |
| Debt-to-Capital | 43.53 % | 46.83 % | 0.00 % |
| Net Debt to EBITDA | 2.13 | 1.85 | 0.00 |
| Current Ratio | 1.33 | 1.52 | 0.00 |
| Quick Ratio | 1.17 | 1.34 | 0.00 |
The company's balance sheet leverage ratios present a moderate risk profile, emphasizing an effective management of liabilities. However, a complete absence of these ratios in 2025 raises concerns about data availability or financial strategy shifts.
📊 Fundamental Strength & Profitability
Metrics here are key for assessing the corporation's intrinsic value and profitability.
| Year | 2023 | 2024 | 2025 |
|---|---|---|---|
| Return on Equity | 16.07 % | 22.47 % | 0.00 % |
| Return on Assets | 7.19 % | 9.67 % | 0.00 % |
| Margins: Net, EBIT, EBITDA, Gross | Net: 18.26% EBIT: 24.28% EBITDA: 35.07% Gross: 29.90% |
Net: 31.64% EBIT: 41.65% EBITDA: 53.64% Gross: 32.49% |
Net: -32.77% EBIT: 0% EBITDA: 0% Gross: 31.41% |
| Research & Development to Revenue | 0.84 % | 0.83 % | 0.80 % |
The data indicates robust profitability levels up to 2024, with noted weakness evident in 2025. This disparity suggests economic or operational challenges that need addressing for future periods.
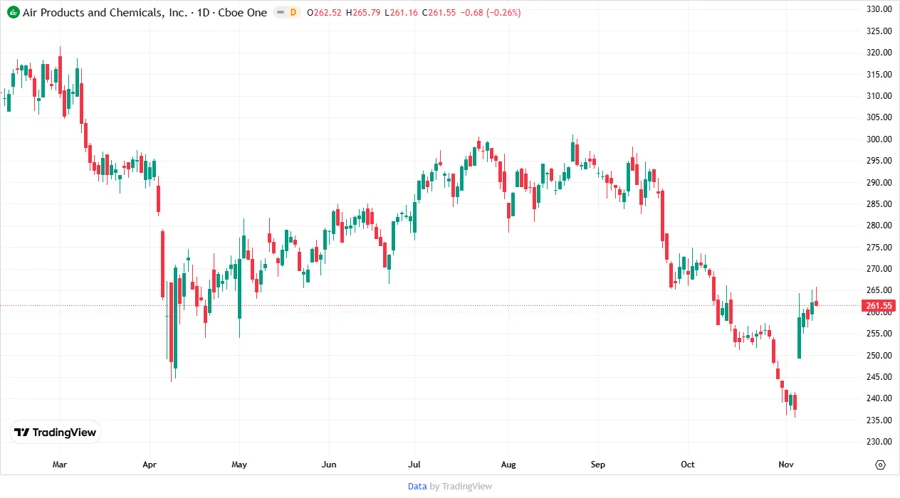
📈 Price Development
📉 Dividend Scoring System
| Criteria | Score | |
|---|---|---|
| Dividend yield | 3 | |
| Dividend Stability | 3 | |
| Dividend growth | 2 | |
| Payout ratio | 2 | |
| Financial stability | 3 | |
| Dividend continuity | 4 | |
| Cashflow Coverage | 1 | |
| Balance Sheet Quality | 3 |
Total Score: 21/40
✅ Rating
Air Products and Chemicals, Inc. demonstrates foundational strength with consistent long-term dividend history. Despite recent economic challenges reflected in its payout ratios and cash flow metrics, its dividend continuity and established market presence make it a stock worth considering for resilient income portfolios with a focus on stability.
Smart Data Insight
Master the Perfect Entry & Exit for this Stock
Don't leave your profits to chance. Historically, this stock follows specific seasonal patterns that institutional traders use to maximize returns.
- ✅ Identify the "Golden Buying Window"
- ✅ Avoid high-risk correction cycles
- ✅ Backtested data from the last 20+ years