
May 27, 2026 a 09:03 am
APA: Trend and Support & Resistance Analysis - APA Corporation
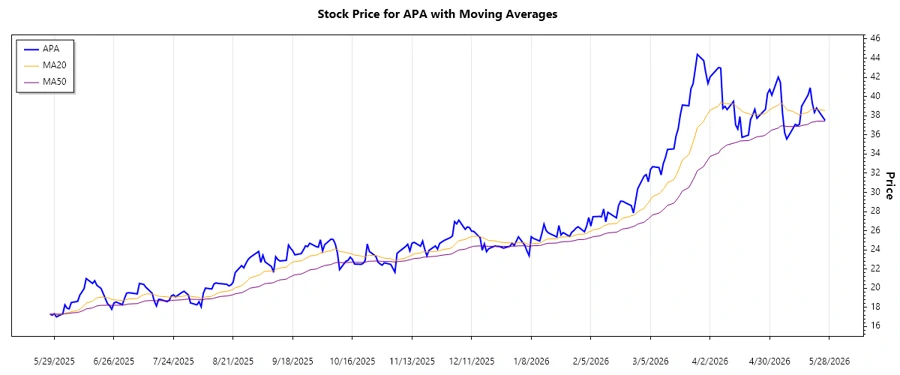
The APA Corporation has shown a mixed performance, with fluctuating trends reflecting the overall volatility in the oil and gas sector. Recently, there has been a noticeable shift indicating an upward momentum, which may present a potential opportunity for investors. However, due to market volatility, it is crucial to keep an eye on emerging support and resistance zones to assess the risk and investment timing better.
Trend Analysis
| Date | Price (Closing) | Trend |
|---|---|---|
| 2026-05-26 | $37.5 | ▲ Uptrend |
| 2026-05-22 | $38.8 | ▲ Uptrend |
| 2026-05-21 | $38.34 | ▲ Uptrend |
| 2026-05-20 | $39.32 | ▲ Uptrend |
| 2026-05-19 | $40.91 | ▲ Uptrend |
| 2026-05-18 | $40.15 | ▲ Uptrend |
| 2026-05-15 | $38.98 | ▲ Uptrend |
The trend analysis based on the EMA20 and EMA50 suggests that there is currently an upward trend in the APA Corporation stock prices. This is indicated by the EMA20 surpassing the EMA50 consistently over the observed period.
Support- and Resistance
| Zone Type | Zone Range |
|---|---|
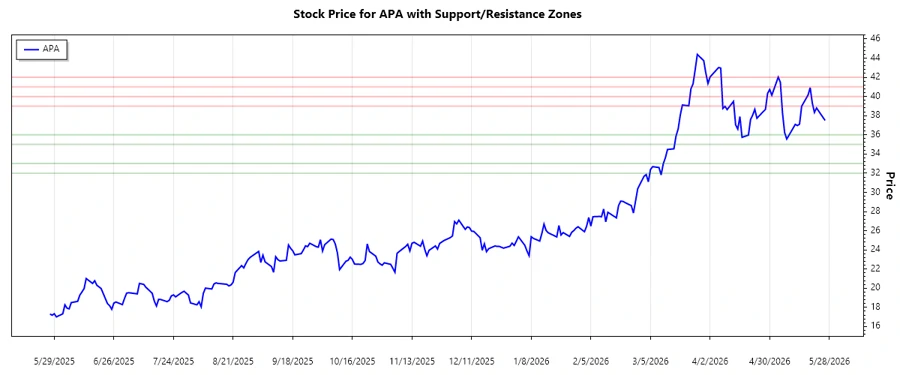
| Support Zone 1 | $35.00 - $36.00 |
| Support Zone 2 | $32.00 - $33.00 |
| Resistance Zone 1 | $39.00 - $40.00 |
| Resistance Zone 2 | $41.00 - $42.00 |
Currently, the stock price is approaching a key resistance zone between $39 and $40. This area could provide upward resistance and may require monitoring to determine if a break above this level is sustainable.
Conclusion
The APA Corporation exhibits a promising upward trend, but it also faces potential challenges from identified resistance levels. Investors should consider the active market conditions and potential risks arising from volatility in commodity prices. An upward break past resistance levels could increase bullish sentiment, whereas a failure to break may lead to price corrections. Proper monitoring, especially around support and resistance zones, along with a thorough market analysis, can help in making informed investment decisions.
Smart Data Insight
Master the Perfect Entry & Exit for this Stock
Don't leave your profits to chance. Historically, this stock follows specific seasonal patterns that institutional traders use to maximize returns.
- ✅ Identify the "Golden Buying Window"
- ✅ Avoid high-risk correction cycles
- ✅ Backtested data from the last 20+ years