September 13, 2025 a 03:15 am


APA: Trend and Support & Resistance Analysis - APA Corporation
The APA Corporation has shown fluctuations in its stock prices influenced significantly by its diverse operations in the oil and gas sector across various countries. Given the recent price movements, identifying trends along with support and resistance zones becomes crucial for predicting future price actions. An analysis leveraging moving averages and historical data assists in understanding potential future trajectories for APA's stock value.
Trend Analysis
Based on the analysis of APA's recent stock price movement, data indicate potential trends determined through exponential moving averages (EMA). Calculating EMA20 and EMA50 provides insights into whether an upward or downward trend persists.
| Date | Closing Price | Trend |
|---|---|---|
| 2025-09-12 | 22.84 | ▲ |
| 2025-09-11 | 22.98 | ▲ |
| 2025-09-10 | 23.29 | ▲ |
| 2025-09-09 | 21.66 | ▼ |
| 2025-09-08 | 22.26 | ▲ |
| 2025-09-05 | 22.75 | ▲ |
| 2025-09-04 | 23.44 | ▲ |
The moving averages indicate an upward trend over the last observed period, as consistent rising prices suggest positive momentum. Technical indicators point to potential further growth, but cautious watch on market factors is recommended.
Support and Resistance
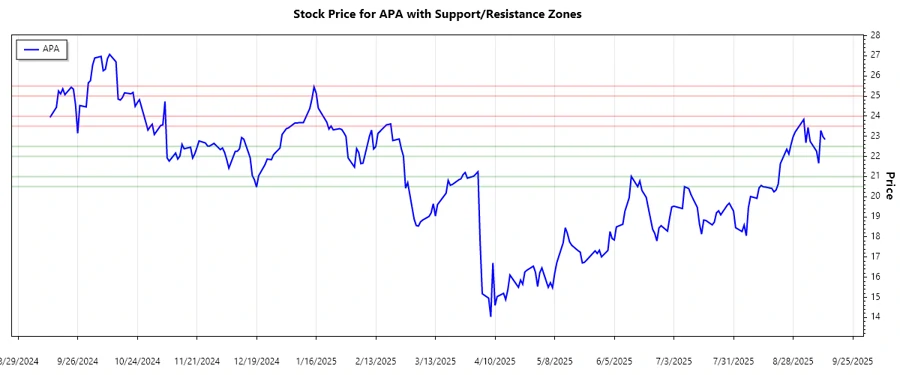
Support and resistance zones provide strategic points for APA's price behavior. Key levels are determined using historical price points, delineating where buying and selling pressures might alter direction.
| Zone Type | From | To |
|---|---|---|
| Support 1 | 22.00 | 22.50 |
| Support 2 | 20.50 | 21.00 |
| Resistance 1 | 23.50 | 24.00 |
| Resistance 2 | 25.00 | 25.50 |
Currently, the stock is closer to the upper support zone, indicating buying interest that may shield the price against further declines. If breached, attention should shift to the lower support threshold.
Conclusion
APA Corporation's current trend indicates an upward movement facilitated by favorable EMA crossovers. A cautiously optimistic view remains pertinent as fundamental and macroeconomic factors could sway the stock either way. Short-term bullish trends suggest potential profit opportunities, yet vigilance towards shifts in oil and gas dynamics remains pivotal. Calculated entry and exit strategies, informed by historical support and resistance, will be fundamental to capitalizing on identified patterns throughout coming sessions.
Smart Data Insight
Master the Perfect Entry & Exit for this Stock
Don't leave your profits to chance. Historically, this stock follows specific seasonal patterns that institutional traders use to maximize returns.
- ✅ Identify the "Golden Buying Window"
- ✅ Avoid high-risk correction cycles
- ✅ Backtested data from the last 20+ years