
October 12, 2025 a 05:15 am
APA: Fibonacci Analysis - APA Corporation
APA Corporation, known for its operations in oil and gas exploration, shows promising resilience in the market. Recent trends exhibit a shift in momentum, reflecting both global oil demand and the company's strategic operational initiatives. For investors, the stock's behavior suggests potential fluctuations but presents opportunities for informed market engagement.
Fibonacci Analysis
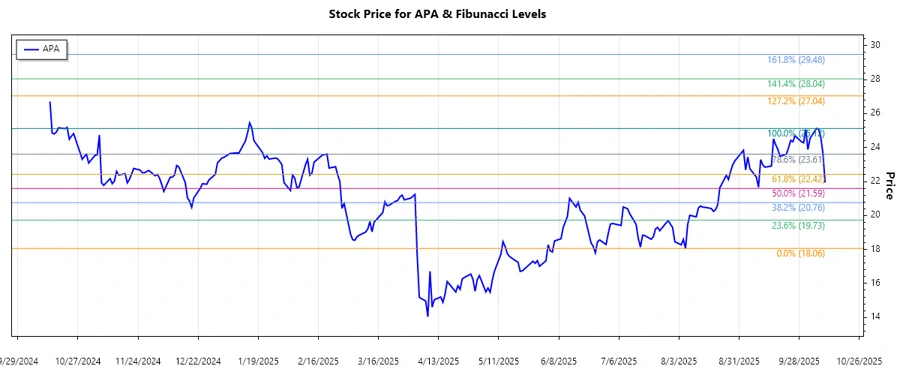
To analyze the APA Corporation stock, we observe an upward trend that began in mid-2025, coming off its low and reaching higher peaks towards October 2025.
| Start Date | End Date | Low Price (Date) | High Price (Date) |
|---|---|---|---|
| 2025-08-06 | 2025-10-08 | $18.06 (2025-08-06) | $25.12 (2025-10-06) |
The Fibonacci Retracement Levels calculated based on this trend are as follows:
| Retracement Level | Price |
|---|---|
| 23.6% | $23.75 |
| 38.2% | $22.79 |
| 50.0% | $21.59 |
| 61.8% | $20.39 |
| 78.6% | $18.87 |
The current price of $21.94 (as of 2025-10-10) is within the 50.0% retracement level. This retracement area potentially acts as a support level, indicating consolidation, and could influence future price movement either towards further recovery or a drift back towards lower support levels.
Conclusion
Overall, APA Corporation exhibits signs of resilience within a challenging commodities market. The stock has shown an impressive recovery from its August lows, reaching a significant high in early October. While the current consolidation around the 50.0% Fibonacci retracement level indicates potential support, market volatility and broader economic factors could influence future trends. Investors are advised to carefully monitor market conditions and the company's operational performance to gauge future investment viability.
Smart Data Insight
Master the Perfect Entry & Exit for this Stock
Don't leave your profits to chance. Historically, this stock follows specific seasonal patterns that institutional traders use to maximize returns.
- ✅ Identify the "Golden Buying Window"
- ✅ Avoid high-risk correction cycles
- ✅ Backtested data from the last 20+ years