September 30, 2025 a 11:45 am
APA: Fibonacci Analysis - APA Corporation
APA Corporation has shown a dynamic performance in the past months as the company has effectively leveraged its global positioning in the oil and gas sector. The company's expanding footprint in United States, Egypt, the UK, and offshore exploration in Suriname suggests adaptive strategic operations. As the market conditions shift, APA's historical trends and technical levels reveal critical points of interests for investors.
Fibonacci Analysis
| Detail | Information |
|---|---|
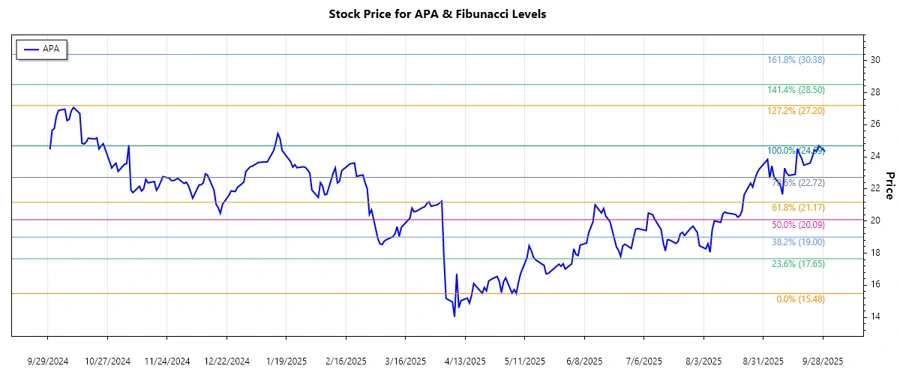
| Trend Duration | 2025-05-07 to 2025-09-29 |
| Highest Price and Date | $24.69 on 2025-09-26 |
| Lowest Price and Date | $15.48 on 2025-05-07 |
| Fibonacci Level | Price Level |
|---|---|
| 0.236 | $17.52 |
| 0.382 | $18.86 |
| 0.5 | $20.09 |
| 0.618 | $21.32 |
| 0.786 | $23.04 |
The current price of $24.34 is above the 0.786 Fibonacci retracement level, suggesting that the current uptrend remains strong. This level could act as a potential resistance, whereas previous levels might offer support in case of a retraction.
Conclusion
APA Corporation shows a robust upward trajectory as evidenced by its recent price movements and the positioning within the Fibonacci retracement levels. The current dominance over key Fibonacci levels indicates strength, yet attention should be given to potential retracement that could offer buying opportunities. Investors should remain vigilant about macroeconomic changes that might impact the oil and gas industry, and keep an eye on emerging support levels in case of market corrections.
JSON Object:
Smart Data Insight
Master the Perfect Entry & Exit for this Stock
Don't leave your profits to chance. Historically, this stock follows specific seasonal patterns that institutional traders use to maximize returns.
- ✅ Identify the "Golden Buying Window"
- ✅ Avoid high-risk correction cycles
- ✅ Backtested data from the last 20+ years