August 04, 2025 a 04:44 pm

APA: Fibonacci Analysis - APA Corporation
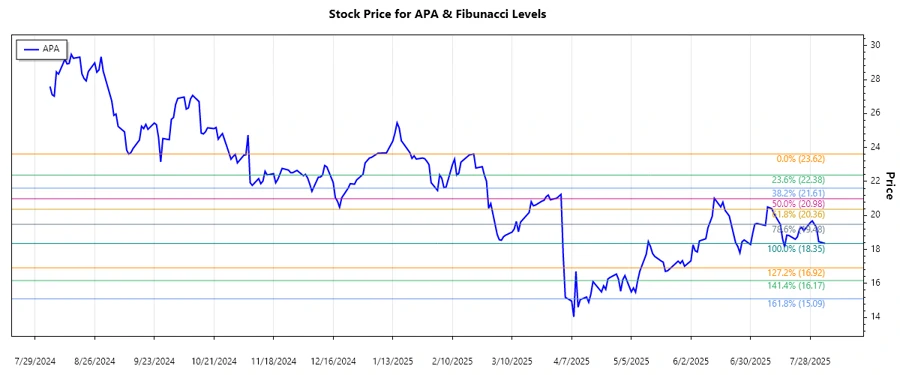
The stock price of APA Corporation has shown significant volatility over the past few months. As a company deeply embedded in the oil and gas sector, the stock is heavily influenced by fluctuations in global energy markets and geopolitical factors. Recent historical analysis suggests a noticeable bearish trend, leading up to a critical junction reflected in current technical patterns.
Fibonacci Analysis
A detailed examination of APA Corporation's stock shows a dominant downward trend from March to August 2025. By implementing Fibonacci retracement analysis, we identify potential levels where price reversals may occur.
| Trend Start Date | Trend End Date | High (Price & Date) | Low (Price & Date) |
|---|---|---|---|
| 2025-02-19 | 2025-08-04 | $23.62 (2025-02-19) | $18.35 (2025-08-04) |
| Fibonacci Level | Price Level |
|---|---|
| 23.6% | $19.89 |
| 38.2% | $20.71 |
| 50% | $20.99 |
| 61.8% | $21.26 |
| 78.6% | $21.67 |
Currently, the stock price is around $18.35, which places it outside of the identified Fibonacci retracement levels. However, should a reversal take place, these levels may serve as potential resistance points.
Technically speaking, the lack of movement into these retracement areas may indicate further continuation of the downward trend unless buying pressure increases and breaches these levels.
Conclusion
APA Corporation's current bearish trajectory poses both risks and opportunities for investors. The persistence of low prices might deter short-term positions, yet they also present potential entry points for long-term value investors should the stock reverse. Ongoing reliance on the oil and gas market's direction demands close attention from analysts. With geopolitical tensions directly impacting energy prices, APA Corporation's stock remains vulnerable to external risks. However, surmounting the identified Fibonacci levels may signal a robust recovery which investors should watch for.
Smart Data Insight
Master the Perfect Entry & Exit for this Stock
Don't leave your profits to chance. Historically, this stock follows specific seasonal patterns that institutional traders use to maximize returns.
- ✅ Identify the "Golden Buying Window"
- ✅ Avoid high-risk correction cycles
- ✅ Backtested data from the last 20+ years