May 11, 2026 a 11:31 am

APA: Dividend Analysis - APA Corporation
APA Corporation presents a compelling dividend profile with its stable dividend history of 45 years. The company's focused dividend policy and strong financials make it an attractive choice for income-seeking investors. Notably, the recent trends show a moderate dividend growth with sustainable payout ratios and a consistent commitment towards shareholder returns.
📊 Overview
Analysing the main dividend parameters of APA Corporation reveals a solid foundation that supports its current dividend yields and sustainability. The company's longstanding commitment to dividends is a positive indicator of financial health and shareholder value.
| Parameter | Details |
|---|---|
| Sector | Energy |
| Dividend Yield | 2.63% |
| Current Dividend per Share | $1.00 |
| Dividend History | 45 years |
| Last Cut or Suspension | None |
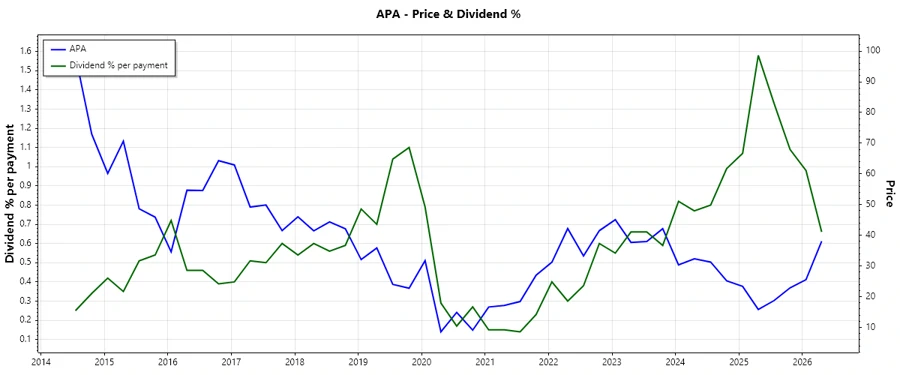
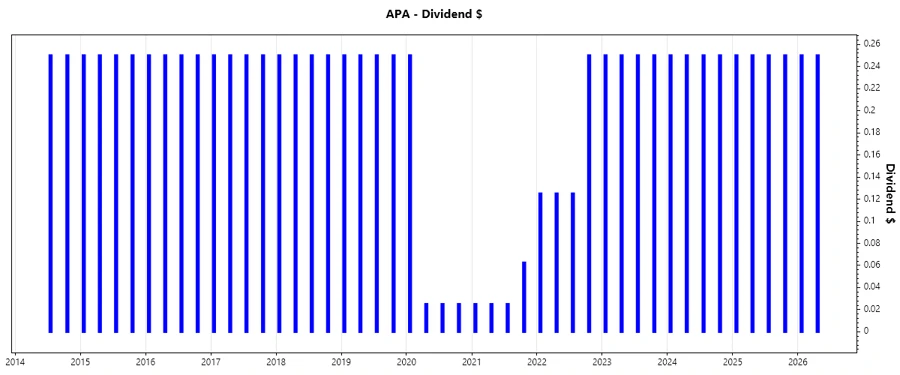
📈 Dividend History
The long-term dividend history of APA Corporation underscores its reliability and commitment to consistent shareholder returns. The company has shown resilience through economic cycles with few interruptions in its dividend payments.
| Year | Dividend per Share (USD) |
|---|---|
| 2026 | $0.50 |
| 2025 | $1.00 |
| 2024 | $1.00 |
| 2023 | $1.00 |
| 2022 | $0.625 |
🗣️ Dividend Growth
Steady dividend growth is a testament to the company’s profit escalation and strategic financial management. It indicates financial health and the ability to reward shareholders progressively.
| Time | Growth |
|---|---|
| 3 years | 16.96% |
| 5 years | 25.21% |
The average dividend growth is 25.21% over 5 years. This shows moderate but steady dividend growth.
✅ Payout Ratio
Payout ratios provide insight into how much of the company's earnings are being returned to shareholders as dividends. Keeping these ratios in check ensures that dividends are sustainable and financed from earnings and cash flows, not borrowings.
| Key figure | Ratio |
|---|---|
| EPS-based | 23.16% |
| Free cash flow-based | 23.87% |
The payout ratios for EPS (23.16%) and FCF (23.87%) indicate sound financial management, allowing flexibility in maintaining dividend payments while reinvesting for growth.
📈 Cashflow & Capital Efficiency
Effective cash flow management ensures that the company can meet its operational needs and payout dividends efficiently. Evaluating capital efficiency metrics can provide insights into how well the company is using its capital to generate returns.
| Metric | 2025 | 2024 | 2023 |
|---|---|---|---|
| Free Cash Flow Yield | 20.26% | 9.43% | 6.98% |
| Earnings Yield | 16.33% | 9.86% | 25.83% |
| CAPEX to Operating Cash Flow | 60.86% | 78.76% | 75.33% |
| Stock-based Compensation to Revenue | 0% | 0% | 0% |
| Free Cash Flow / Operating Cash Flow Ratio | 39.14% | 21.24% | 24.67% |
APA Corporation’s cash flow metrics demonstrate effective utilization of cash and indicate a robust capability to maintain dividend payments alongside operations and investment needs.
🗣️ Balance Sheet & Leverage Analysis
Analysing leverage and liquidity ratios reveals APA Corporation’s ability to handle its debt obligations and maintain stable financial flexibility. A strong balance sheet is vital for safeguarding long-term dividend sustainability.
| Metric | 2025 | 2024 | 2023 |
|---|---|---|---|
| Debt-to-Equity | 78.94% | 116.70% | 199.77% |
| Debt-to-Assets | 25.32% | 31.78% | 34.79% |
| Debt-to-Capital | 44.12% | 53.85% | 66.64% |
| Net Debt to EBITDA | 0.79 | 1.33 | 1.10 |
| Current Ratio | 0.825 | 1.152 | 1.024 |
| Quick Ratio | 0.688 | 1.008 | 0.836 |
| Financial Leverage | 3.12 | 3.67 | 5.74 |
APA Corporation's balance sheet depicts moderate leverage levels, generally adherent to industry standards. A comprehensive risk management approach ensures fiscal resilience.
📈 Fundamental Strength & Profitability
Measures of profitability and capital utilization reveal APA Corporation's efficiency in managing its resources and its capability to generate returns, critical factors for consistent dividends.
| Metric | 2025 | 2024 | 2023 |
|---|---|---|---|
| Return on Equity | 23.54% | 15.23% | 107.53% |
| Return on Assets | 7.55% | 4.15% | 18.73% |
| Margins: Net | 16.08% | 8.26% | 34.48% |
| Margins: EBIT | 32.56% | 19.60% | 38.77% |
| Margins: EBITDA | 60.93% | 42.87% | 57.37% |
| Margins: Gross | 37.32% | 44.18% | 51.06% |
| Research & Development to Revenue | 0% | 0% | 0% |
The profitability metrics reflect APA Corporation's strong legacy of value realization, affirming its potential to sustain rewarding dividends perpetually.
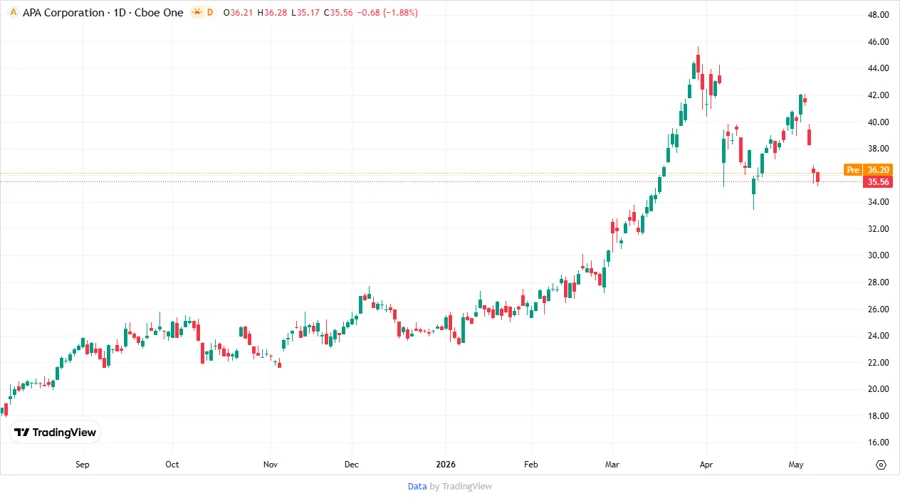
📈 Price Development
🗣️ Dividend Scoring System
| Criteria | Score | Score Bar |
|---|---|---|
| Dividend Yield | 4 | |
| Dividend Stability | 5 | |
| Dividend Growth | 4 | |
| Payout Ratio | 5 | |
| Financial Stability | 4 | |
| Dividend Continuity | 5 | |
| Cashflow Coverage | 4 | |
| Balance Sheet Quality | 4 |
Total Score: 35/40
✅ Rating
APA Corporation showcases robust financial health backed by a strong dividend track record. Its balanced payout ratios, consistent dividend growth, and resilient balance sheet suggest a promising prospect for yield-oriented investors. Given these positive attributes, APA Corporation represents a compelling investment choice for those seeking stable dividend income and long-term value appreciation.
Smart Data Insight
Master the Perfect Entry & Exit for this Stock
Don't leave your profits to chance. Historically, this stock follows specific seasonal patterns that institutional traders use to maximize returns.
- ✅ Identify the "Golden Buying Window"
- ✅ Avoid high-risk correction cycles
- ✅ Backtested data from the last 20+ years