
April 07, 2026 a 07:46 am

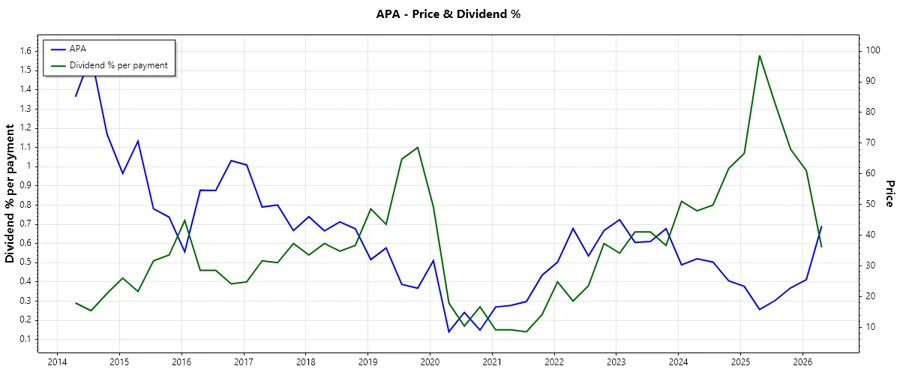


📊 APA: Dividend Analysis - APA Corporation
APA Corporation demonstrates a consistent dividend history with moderate growth and stability in its payouts. With a 2.32% dividend yield and comprehensive coverage ratios, APA offers a balanced investment opportunity, ensuring both income and growth potential for investors. The firm’s commitment to maintaining a robust payout policy is evident from its extended history and ongoing shareholder returns.
Overview 🗣️
APA Corporation, positioned in the energy sector, maintains a competitive dividend yield of 2.32%. Its steady dividend contributions span 45 years without any recent cuts or suspensions, indicating a commitment to shareholder returns. Such consistency enhances APA's attractiveness to income-focused investors.
| Key Metrics | Details |
|---|---|
| Sector | Energy |
| Dividend Yield | 2.32% |
| Current Dividend per Share | 1.00 USD |
| Dividend History | 45 years |
| Last Cut or Suspension | None |
Dividend History 📅
APA’s dividend history is critical, reflecting its reliability and shareholder value delivery. Its consistent performance over four decades without major interruptions reassures investors of stable income streams.
| Year | Dividend per Share (USD) |
|---|---|
| 2026 | 0.50 |
| 2025 | 1.00 |
| 2024 | 1.00 |
| 2023 | 1.00 |
| 2022 | 0.625 |
Dividend Growth 📈
APA’s dividend growth metrics highlight promising gains, with a 3-year growth rate of 16.96% and a 5-year growth rate of 25.21%. Such performance underscores a slow but deliberate growth pattern beneficial to long-term income strategies.
| Time | Growth |
|---|---|
| 3 years | 16.96% |
| 5 years | 25.21% |
The average dividend growth is 25.21% over 5 years. This shows moderate but steady dividend growth.
Payout Ratio ✅
APA’s payout ratios are indicative of sustainable dividend policies. An EPS payout ratio of 24.82% and a FCF payout ratio of 19.91% reflect a balanced approach, leveraging corporate earnings while retaining internal resources for growth activities.
| Metric | Ratio |
|---|---|
| EPS-based | 24.82% |
| Free Cash Flow-based | 19.91% |
These ratios suggest that APA has a healthy cushion to support dividend payouts, providing reassurance about financial robustness.
Cashflow & Capital Efficiency 💸
APA Corporation's superior cash flow generation is demonstrated through metrics like a Free Cash Flow Yield of 11.71% and a positive CAPEX-to-Operating Cash Flow ratio. Such indicators reflect APA's capability to efficiently reinvest in operations while maintaining cash reserves, critical to sustaining long-term growth and providing shareholder returns.
| Year | 2023 | 2024 | 2025 |
|---|---|---|---|
| Free Cash Flow Yield | 6.99% | 9.43% | 20.26% |
| Earnings Yield | 25.83% | 9.86% | 16.33% |
| CAPEX to Operating Cash Flow | 60.86% | 78.76% | 60.86% |
| Stock-Based Compensation to Revenue | 0% | 0% | 0% |
| Free Cash Flow / Operating Cash Flow Ratio | 39.14% | 21.24% | 39.14% |
APA's financial metrics reveal a strong cash position and efficient use of capital, which is pivotal in sustaining long-term investment returns.
Balance Sheet & Leverage Analysis ⚖️
Examining APA's balance sheet and leverage ratios, APA reveals a cautious capital structure with a debt-to-equity ratio of 78.94% in 2025. These metrics emphasize its strategic debt management, providing stability amid market fluctuations.
| Year | 2023 | 2024 | 2025 |
|---|---|---|---|
| Debt-to-Equity | 199.77% | 116.70% | 78.94% |
| Debt-to-Assets | 34.79% | 31.78% | 25.32% |
| Debt-to-Capital | 66.64% | 53.85% | 44.12% |
| Net Debt to EBITDA | 1.10 | 1.33 | 0.79 |
| Current Ratio | 1.02 | 1.15 | 0.82 |
| Quick Ratio | 0.84 | 1.01 | 0.69 |
| Financial Leverage | 5.74 | 3.67 | 3.12 |
APA's leverage and liquidity measures reflect a stable financial foundation and effective debt management strategy, ensuring long-term sustainability.
Fundamental Strength & Profitability 📉
APA's profitability is underscored by substantial ROE and ROA figures. Review of net, EBIT, and EBITDA margins illustrate efficient operation and profitability at various stages, contributing to robust financial health.
| Year | 2023 | 2024 | 2025 |
|---|---|---|---|
| Return on Equity | 107.53% | 15.23% | 23.54% |
| Return on Assets | 18.73% | 4.15% | 7.55% |
| Net Margin | 34.48% | 8.26% | 16.08% |
| EBIT Margin | 38.77% | 19.60% | 32.56% |
| EBITDA Margin | 57.37% | 42.87% | 60.93% |
| Gross Margin | 51.06% | 44.18% | 37.32% |
| Research & Development to Revenue | 0% | 0% | 0% |
APA’s fundamental strengths highlight its capacity to generate profits and sustain operational efficiency, vital for shareholder returns.
Price Development 📈
Dividend Scoring System 🎯
| Criteria | Score (1-5) | Score Bar |
|---|---|---|
| Dividend yield | 3 | |
| Dividend Stability | 5 | |
| Dividend growth | 3 | |
| Payout ratio | 4 | |
| Financial stability | 4 | |
| Dividend continuity | 5 | |
| Cashflow Coverage | 4 | |
| Balance Sheet Quality | 3 |
Total Score: 31/40
Rating ⭐️
APA Corporation presents a strong investment case with steady dividends and robust payout metrics, signifying a blend of security and growth potential. Investors may find APA appealing due to its reliable income streams, grounded in a solid balance sheet and steady cash flow, providing a compelling opportunity for both income and value-oriented portfolios.
Smart Data Insight
Master the Perfect Entry & Exit for this Stock
Don't leave your profits to chance. Historically, this stock follows specific seasonal patterns that institutional traders use to maximize returns.
- ✅ Identify the "Golden Buying Window"
- ✅ Avoid high-risk correction cycles
- ✅ Backtested data from the last 20+ years