December 20, 2025 a 02:46 am


APA: Dividend Analysis - APA Corporation
APA Corporation exhibits a solid dividend history with consistent payouts, reflecting a robust track record in shareholder value distribution. However, recent payload adjustments may signal strategic recalibrations or market-conditioned responses.
📊 Overview
The overall evaluation of APA Corporation’s dividend profile indicates a mixed picture. Despite a robust historical dividend practice over 45 years, recent cuts might present challenges.
| Aspect | Details |
|---|---|
| Sector | Energy |
| Dividend yield | 4.12 % |
| Current dividend per share | 1 USD |
| Dividend history | 45 years |
| Last cut or suspension | 2026 |
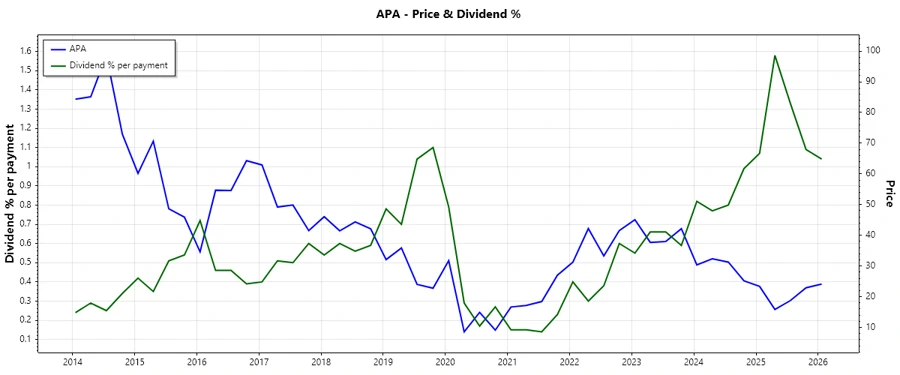
🗣️ Dividend History
The long-standing dividend tradition of APA Corporation is an indicator of a stable revenue base. However, any cuts may impact investor confidence.
| Year | Dividend per Share (USD) |
|---|---|
| 2026 | 0.25 |
| 2025 | 1.00 |
| 2024 | 1.00 |
| 2023 | 1.00 |
| 2022 | 0.625 |
📈 Dividend Growth
APA Corporation's dividend growth is stagnant over a 5-year timeline, with minimal growth over the past 3 years. A strategic rethink may be needed to reignite dividend growth.
| Time | Growth |
|---|---|
| 3 years | 0.94 % |
| 5 years | 0% |
The average dividend growth is 0% over 5 years. This shows stagnant dividend growth and potential underlying strategic issues.
📉 Payout Ratio
The payout ratios indicate a conservative approach, with the EPS-based ratio at 23.92% and the Free Cash Flow basis at 18.64%. These suggest room for growth in dividend disbursements.
| Key figure | Ratio |
|---|---|
| EPS-based | 23.92 % |
| Free cash flow-based | 18.64 % |
With a relatively low payout ratio, APA Corporation may have ample opportunities to increase dividends if there are no substantial capital expenditures in sight.
✅ Cashflow & Capital Efficiency
Cashflow indicators are essential for understanding the company’s ability to maintain or grow its dividend payouts. APA displays a strong free cash flow yield and earnings yield, highlighting the company's cash efficiency. The low stock-based compensation relative to revenue signals controlled shareholder dilution risk.
| Metric | 2024 | 2023 | 2022 |
|---|---|---|---|
| Free Cash Flow Yield | 9.43% | 6.98% | 16.42% |
| Earnings Yield | 9.86% | 25.83% | 23.71% |
| CAPEX to Operating Cash Flow | 60.13% | 75.33% | 48.51% |
| Stock-based Compensation to Revenue | 0% | 0% | 0% |
| Free Cash Flow / Operating Cash Flow Ratio | 21.24% | 24.67% | 51.49% |
APA's capital efficiency is favorable, with consistent cash flow yield metrics. Their capability to generate cash suggests a resilient model capable of weathering economic disruptions.
⚠️ Balance Sheet & Leverage Analysis
Balance sheet strength is crucial for financial stability. APA's leverage ratios demonstrate good debt management, with a steady debt-to-capital coverage and an operational quick ratio. This should insulate APA from liquidity shocks.
| Metric | 2024 | 2023 | 2022 |
|---|---|---|---|
| Debt-to-Equity | 116.70% | 199.77% | 1328.61% |
| Debt-to-Assets | 31.78% | 34.79% | 42.75% |
| Debt-to-Capital | 53.85% | 66.64% | 93.00% |
| Net Debt to EBITDA | 1.33 | 1.10 | 0.71 |
| Current Ratio | 1.15 | 1.02 | 0.93 |
| Quick Ratio | 1.01 | 0.84 | 0.78 |
| Financial Leverage | 3.67 | 5.74 | 31.08 |
APA's financial metrics indicate strong fundamentals, despite potential volatility in debt levels. This allows APA the flexibility to adjust their capital structure if required.
📊 Fundamental Strength & Profitability
APA Corporation’s profitability metrics are competitive, with positive margins across net and EBITDA margins bolstered by strong returns on equity and assets.
| Metric | 2024 | 2023 | 2022 |
|---|---|---|---|
| Return on Equity | 15.23% | 107.53% | 868.56% |
| Return on Assets | 4.15% | 18.73% | 27.95% |
| Margins: Net | 8.26% | 34.48% | 33.17% |
| EBIT | 19.60% | 38.77% | 54.68% |
| EBITDA | 42.87% | 57.37% | 68.74% |
| Gross | 44.18% | 51.06% | 56.48% |
| R&D to Revenue | 0% | 0% | 0% |
APA Corporation displays solid profitability, with robust margins and returns that suggest effective use of capital and operational efficiency.
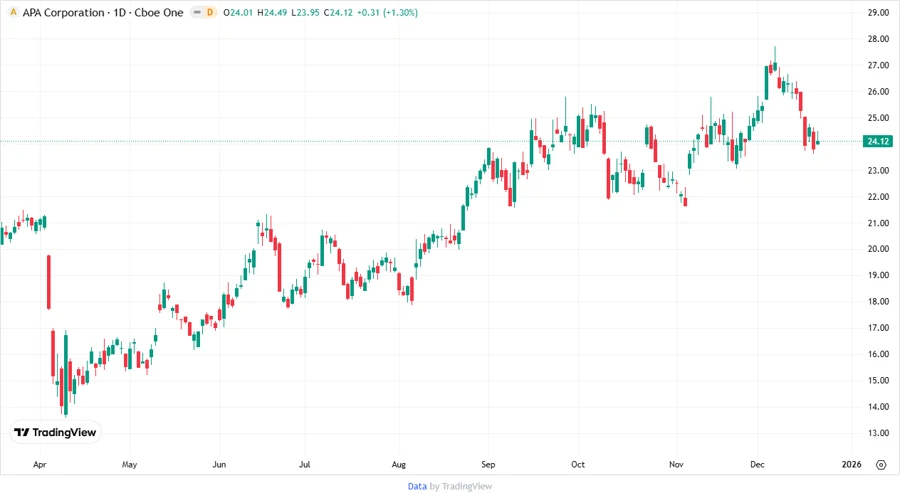
📈 Price Development
🎯 Dividend Scoring System
| Criterion | Score | Assessment |
|---|---|---|
| Dividend yield | 4 | |
| Dividend Stability | 3 | |
| Dividend growth | 2 | |
| Payout ratio | 4 | |
| Financial stability | 3 | |
| Dividend continuity | 3 | |
| Cashflow Coverage | 4 | |
| Balance Sheet Quality | 3 |
Overall Score: 26/40
📢 Rating
APA Corporation is a traditionally strong dividend payer with financial fundamentals backing its capacity for payouts. Yet, signs of income stream adjustments require caution. Overall, APA is a moderate buy for income-focused investors keeping a watch on macro pressures and strategic shifts.