
July 18, 2026 a 06:44 am
AOS: Fibonacci Analysis - A. O. Smith Corporation
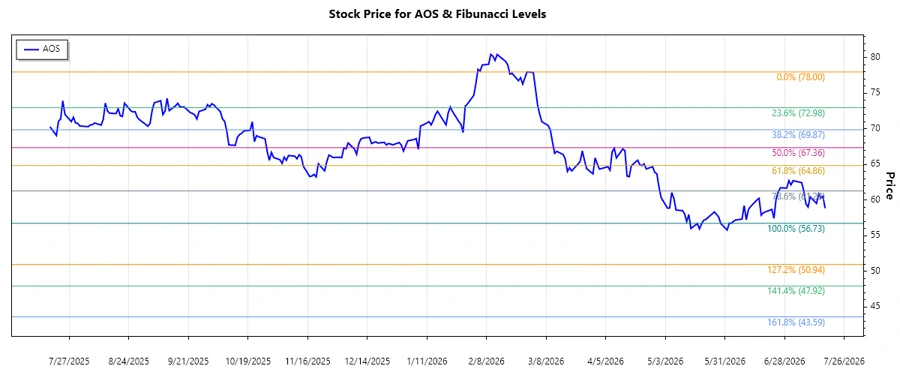
The A. O. Smith Corporation (AOS) has displayed notable price fluctuations recently, holding significant potential for both growth and decline. Over the past months, the stock showed a dominant downtrend starting in March 2026. This has positioned its current price within a key retracement area, suggesting potential resistance or support levels in the near term. Investors should be cautious as the current technical indicators are mixed.
Fibonacci Analysis
| Aspect | Details |
|---|---|
| Analysis Period | 2026-03-02 to 2026-07-17 |
| High Price (Date) | $78.00 (2026-02-27) |
| Low Price (Date) | $56.73 (2026-06-03) |
| Fibonacci Levels |
|
| Current Price | $58.85 |
| Retracement Zone | none |
| Technical Interpretation | Currently, the stock price is below the lowest retracement level, indicating potential ongoing bearish sentiment. Unless it moves back up into the 0.236 Fibonacci level, downside risks remain prevalent. |
Conclusion
In summary, A. O. Smith Corporation's stock is currently trading in a critical range that could determine its near-term trajectory. The apparent resistance levels at higher Fibonacci points suggest that overcoming these could lead to bullish momentum. Conversely, failure to rise above these retracement levels may lead the stock price lower, facing potential support near the recent lows. For investors, the current technical setup suggests a cautious approach, balancing the potential for recovery against the risks of continued declines.
Smart Data Insight
Master the Perfect Entry & Exit for this Stock
Don't leave your profits to chance. Historically, this stock follows specific seasonal patterns that institutional traders use to maximize returns.
- ✅ Identify the "Golden Buying Window"
- ✅ Avoid high-risk correction cycles
- ✅ Backtested data from the last 20+ years