August 18, 2025 a 04:45 pm

AOS: Fibonacci Analysis - A. O. Smith Corporation
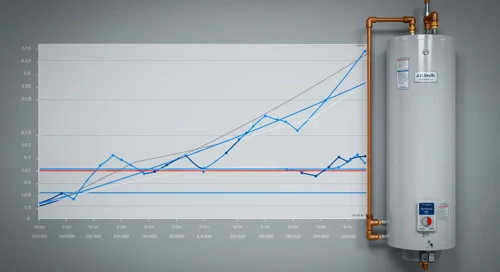
A. O. Smith Corporation has displayed a strengthening trend in recent months, buoyed by strong demand for its water heaters and treatment products globally. The company's operations in North America and the Rest of the World provide a diverse revenue stream. Analyzing its recent price movements offers insights into potential price levels for support and resistance, useful for investors considering entry or exit points based on the latest trend data.
Fibonacci Analysis
| Detail | Value |
|---|---|
| Start Date | 2024-08-19 |
| End Date | 2025-08-18 |
| High Point | 90.59 on 2024-09-27 |
| Low Point | 62.74 on 2025-06-20 |
| Fibonacci Level | Price Level |
|---|---|
| 0.236 | 70.13 |
| 0.382 | 74.83 |
| 0.5 | 78.67 |
| 0.618 | 82.52 |
| 0.786 | 87.06 |
The current price is at 72.29, which falls near the 0.236 retracement level. This suggests that there could be potential for further retracement or resistance at this level.
Technically, being near a Fibonacci retracement level suggests potential support, indicating a possible bounce or consolidation near this price.
Conclusion
The recent downtrend from its high presents both challenges and opportunities for A. O. Smith Corporation. If the price continues to hover near the 0.236 retracement level, it could signify a stabilizing phase before another potential upward movement. However, the risks include breaking below the current retracement level, leading to further declines. Investors should watch closely for the stock's movement around this key level to make informed decisions. The diverse geographical presence provides some risk mitigation, offering a balance between market-specific and global factors.
Smart Data Insight
Master the Perfect Entry & Exit for this Stock
Don't leave your profits to chance. Historically, this stock follows specific seasonal patterns that institutional traders use to maximize returns.
- ✅ Identify the "Golden Buying Window"
- ✅ Avoid high-risk correction cycles
- ✅ Backtested data from the last 20+ years