February 08, 2026 a 07:31 am

AOS: Dividend Analysis - A. O. Smith Corporation
A. O. Smith Corporation, with a rich history of 42 years of dividend growth, showcases stability and reliability for income-seeking investors. With a current dividend yield of 1.91% and a solid track record, the company represents a steadfast choice in the Industrial Goods sector. As a quality industrial manufacturer, AOS has demonstrated consistent fiscal discipline contributing to its strong financial health and capacity to maintain shareholder returns.
Overview 📊
A. O. Smith Corporation operates in the Industrial Goods sector, displaying a commendable dividend history over the past 42 years. With a dividend yield of 1.91% and a current dividend per share of $1.40, the company has never cut or suspended its dividends, showcasing its commitment to maintaining steady income for investors.
| Attribute | Value |
|---|---|
| Sector | Industrial Goods |
| Dividend yield | 1.91% |
| Current dividend per share | $1.40 USD |
| Dividend history | 42 years |
| Last cut or suspension | None |
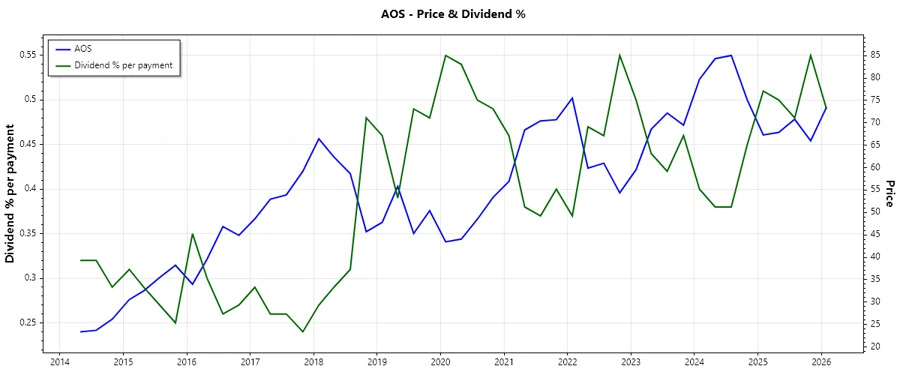
Dividend History 📈
The historical dividend payments reflect A. O. Smith's commitment to shareholders. A consistent upward trend in dividends is indicative of the company's strong cash flow management and revenue-generating capabilities, which are vital for maintaining stakeholder trust.
| Year | Dividend per Share (USD) |
|---|---|
| 2026 | $0.36 |
| 2025 | $1.38 |
| 2024 | $1.30 |
| 2023 | $1.22 |
| 2022 | $1.14 |
Dividend Growth 🗣️
Dividend growth is a crucial metric for assessing the sustainability of dividends. Over the last three years, AOS has exhibited a growth rate of 6.58%, while the five-year growth rate stands at 7.09%. These figures highlight a moderate yet consistent increase that supports the company's financial robustness and strategic growth initiatives.
| Time | Growth |
|---|---|
| 3 years | 6.58% |
| 5 years | 7.09% |
The average dividend growth is 7.09% over 5 years. This shows moderate but steady dividend growth.
Payout Ratio ✅
Payout ratios offer insight into a company's ability to maintain its dividend payments. AOS displays a prudent approach with an EPS-based payout ratio of 35.83% and a free cash flow-based payout of 36.35%. Such healthy ratios indicate sufficient coverage of dividends from earnings and cash flows, leaving ample room for reinvestment in the business.
| Key figure ratio | Value |
|---|---|
| EPS-based | 35.83% |
| Free cash flow-based | 36.35% |
AOS's payout ratios are conservative, suggesting a well-managed dividend policy with a margin of safety for future challenges.
Cashflow & Capital Efficiency 💡
Analyzing cash flow and capital efficiency provides a holistic view of financial health. AOS's ratios illustrate robust cash flow management with strong Earnings Yield and moderate CAPEX expenditures ensuring sustainable operations.
| Key Metric | 2025 | 2024 | 2023 |
|---|---|---|---|
| Free Cash Flow Yield | 5.83% | 4.72% | 4.83% |
| Earnings Yield | 5.84% | 5.32% | 4.50% |
| CAPEX to Operating Cash Flow | 11.48% | 18.56% | 10.83% |
| Stock-based Compensation to Revenue | 0.36% | 0.39% | 0.30% |
| Free Cash Flow / Operating Cash Flow Ratio | 88.52% | 81.44% | 89.17% |
AOS's cash flow metrics reveal a stable and disciplined financial strategy characterized by efficient capital usage and a commitment to sustainable shareholder returns.
Balance Sheet & Leverage Analysis 📉
AOS's strong balance sheet is underscored by low leverage ratios. Low debt-to-equity and debt-to-assets ratios highlight conservative capital management, indicating a low-risk financial structure conducive to stability in varying economic climates.
| Key Metric | 2025 | 2024 | 2023 |
|---|---|---|---|
| Debt-to-Equity | 12.34% | 11.51% | 8.41% |
| Debt-to-Assets | 7.29% | 6.69% | 4.83% |
| Debt-to-Capital | 10.98% | 10.32% | 7.76% |
| Net Debt to EBITDA | 6.90% | -2.91% | -22.42% |
| Current Ratio | 1.50 | 1.55 | 1.59 |
| Quick Ratio | 0.94 | 0.96 | 1.06 |
| Financial Leverage | 1.69 | 1.72 | 1.74 |
AOS's balance sheet signifies a strategic limitation on financial leverage, preserving its flexibility to capitalize on future growth opportunities while safeguarding financial stability.
Fundamental Strength & Profitability 📉
Profitability metrics such as return on equity and margins are vital indicators of corporate performance. AOS's steady margins and strong equity returns reflect operational efficiency and a capable management team committed to maximizing shareholder value.
| Key Metric | 2025 | 2024 | 2023 |
|---|---|---|---|
| Return on Equity | 29.40% | 28.33% | 30.18% |
| Return on Assets | 17.38% | 16.47% | 17.32% |
| Margins: Net | 14.26% | 13.98% | 14.45% |
| EBIT | 19.04% | 18.54% | 19.35% |
| EBITDA | 20.68% | 20.60% | 21.38% |
| Gross | 38.83% | 38.14% | 38.54% |
| R&D to Revenue | - | 2.66% | 2.53% |
Continued strength in profitability margins coupled with conservative R&D spending underscore AOS's carefully balanced strategy for sustained long-term returns.
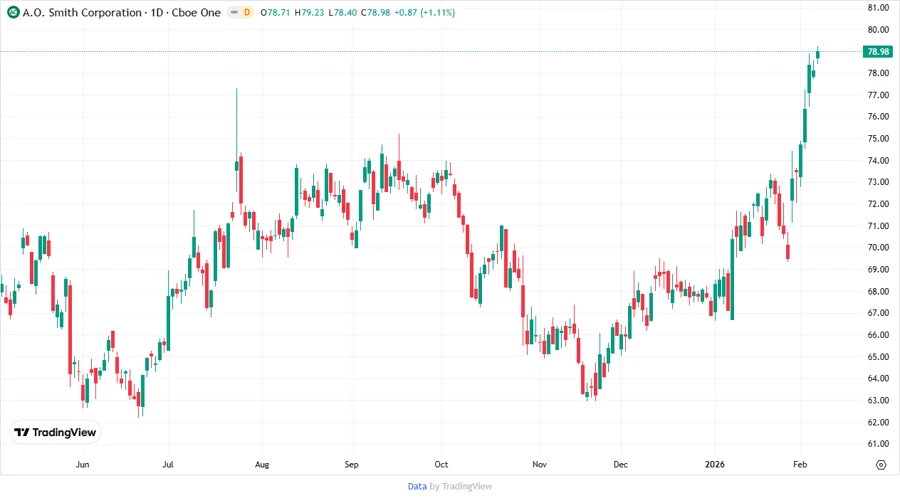
Price Development
Dividend Scoring System 🗣️
The Dividend Scoring System is designed to evaluate key aspects influencing the sustainability and attractiveness of A. O. Smith Corporation's dividends.
| Category | Score | Score Bar |
|---|---|---|
| Dividend yield | 3 | |
| Dividend Stability | 5 | |
| Dividend growth | 4 | |
| Payout ratio | 4 | |
| Financial stability | 5 | |
| Dividend continuity | 5 | |
| Cashflow Coverage | 4 | |
| Balance Sheet Quality | 5 |
Overall Score: 35 out of 40
Rating 🏆
A. O. Smith Corporation's outstanding financial discipline and commitment to shareholder returns grant it a strong recommendation for dividend-focused investors. With a robust dividend history and resilient financial metrics, AOS is poised to deliver continuous value for shareholders. Armored with stability and strategic growth, AOS remains a premier choice for those seeking reliable income flows in the industrial sector.