January 23, 2026 a 02:47 am
AOS: Dividend Analysis - A. O. Smith Corporation
A. O. Smith Corporation has demonstrated remarkable dividend consistency, with over four decades of unbroken distributions. The company's robust dividend yield, coupled with its impressive historical growth, signals strong financial health and a commitment to rewarding shareholders. Its stable payout ratios further underscore its capacity to maintain and potentially increase dividends in the future.
Overview
📊A deep dive into A. O. Smith Corporation reveals a well-rounded dividend strategy within the Industrials sector. The current metrics underline its solid fiscal approach and breadth in shareholder returns.
| Metric | Value |
|---|---|
| Sector | Industrials |
| Dividend yield | 1.92 % |
| Current dividend per share | 1.30 USD |
| Dividend history | 42 years |
| Last cut or suspension | None |
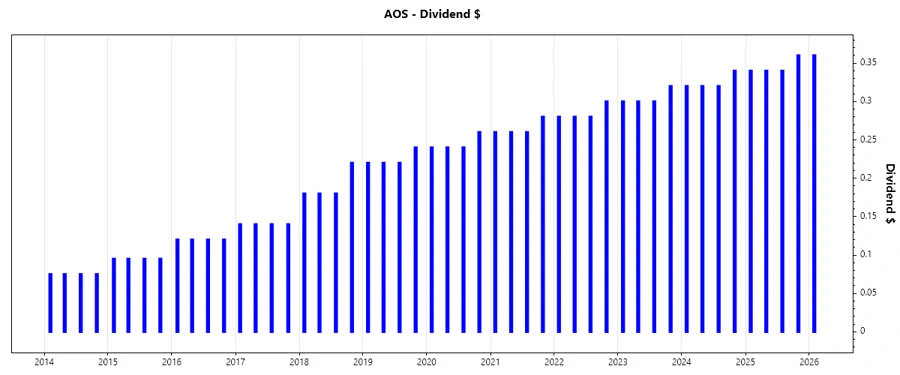
Dividend History
📈Continuous dividend payments since 1981 make A. O. Smith a reliable partner for long-term investors. The company has not cut or suspended dividends despite economic cycles, affirming its resilience.
| Year | Dividend per Share (USD) |
|---|---|
| 2026 | 0.36 |
| 2025 | 1.38 |
| 2024 | 1.30 |
| 2023 | 1.22 |
| 2022 | 1.14 |
Dividend Growth
📊Dividend growth is a critical indicator of a company’s potential to enhance shareholder value. Over both three and five-year periods, A. O. Smith has shown consistent escalation, highlighting operational efficiency and effective capital management.
| Time | Growth |
|---|---|
| 3 years | 6.58 % |
| 5 years | 7.09 % |
The average dividend growth is 7.09 % over 5 years. This shows moderate but steady dividend growth.
Payout Ratio
🗣️Payout ratios indicate the proportion of earnings and cash flow dedicated to dividends, essential to assess sustainability. A. O. Smith's judicious percentages suggest sound fiscal management.
| Key figure | Ratio |
|---|---|
| EPS-based | 34.40 % |
| Free cash flow-based | 32.27 % |
Both EPS-based and FCF-based payout ratios fall well within the acceptable range, indicating a balanced approach to rewarding shareholders while retaining enough earnings for reinvestment and debt servicing.
Cashflow & Capital Efficiency
📈Analyzing cash flow metrics helps investors determine how efficiently a company generates cash from its revenue, which directly impacts dividend payouts and financial flexibility.
| Metric | 2024 | 2023 | 2022 |
|---|---|---|---|
| Free Cash Flow Yield | 4.73% | 4.83% | 3.62% |
| Earnings Yield | 5.32% | 4.50% | 2.66% |
| CAPEX to Operating Cash Flow | 18.56% | 10.83% | 17.96% |
| Stock-based Compensation to Revenue | 0.39% | 0.30% | 0.30% |
| Free Cash Flow / Operating Cash Flow Ratio | 81.44% | 89.17% | 82.04% |
Remarkable consistency in Free Cash Flow yields and prudent CAPEX allocations lead to sustainable cash flows, favorably influencing dividend coverage and growth potential.
Balance Sheet & Leverage Analysis
📉This analysis is crucial for evaluating the company's ability to meet long-term obligations and withstand financial stress.
| Metric | 2024 | 2023 | 2022 |
|---|---|---|---|
| Debt-to-Equity | 11.51% | 8.41% | 20.99% |
| Debt-to-Assets | 6.69% | 4.83% | 11.01% |
| Debt-to-Capital | 10.32% | 7.76% | 17.35% |
| Net Debt to EBITDA | -2.91% | -22.42% | -7.84% |
| Current Ratio | 1.55 | 1.59 | 1.75 |
| Quick Ratio | 0.96 | 1.06 | 1.20 |
| Financial Leverage | 1.72 | 1.74 | 1.91 |
A. O. Smith maintains a low debt structure compared to equity and assets, signifying financial stability and reduced risk, beneficial for dividend security.
Fundamental Strength & Profitability
✅Assessing fundamental strength gives insight into profitability and the company's ability to generate returns on investments, critical for long-term growth.
| Metric | 2024 | 2023 | 2022 |
|---|---|---|---|
| Return on Equity | 28.33% | 30.18% | 13.49% |
| Return on Assets | 16.47% | 17.32% | 7.07% |
| Return on Invested Capital | 23.19% | 25.22% | 27.35% |
| Margins: Net | 13.98% | 14.45% | 6.28% |
| EBIT Margin | 18.54% | 19.35% | 6.21% |
| EBITDA Margin | 20.60% | 21.38% | 8.26% |
| Gross Margin | 38.14% | 38.54% | 35.42% |
| Research & Development to Revenue | 2.66% | 2.53% | 2.37% |
Strong profitability margins and a consistent return on equity demonstrate A. O. Smith's ability to translate sales into significant shareholder returns.
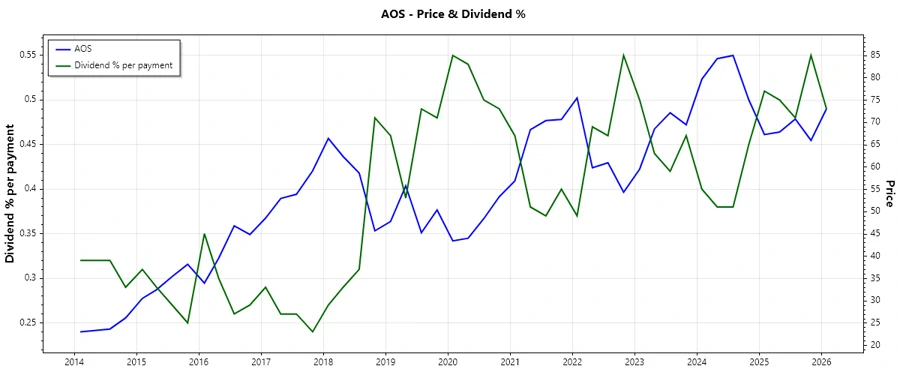
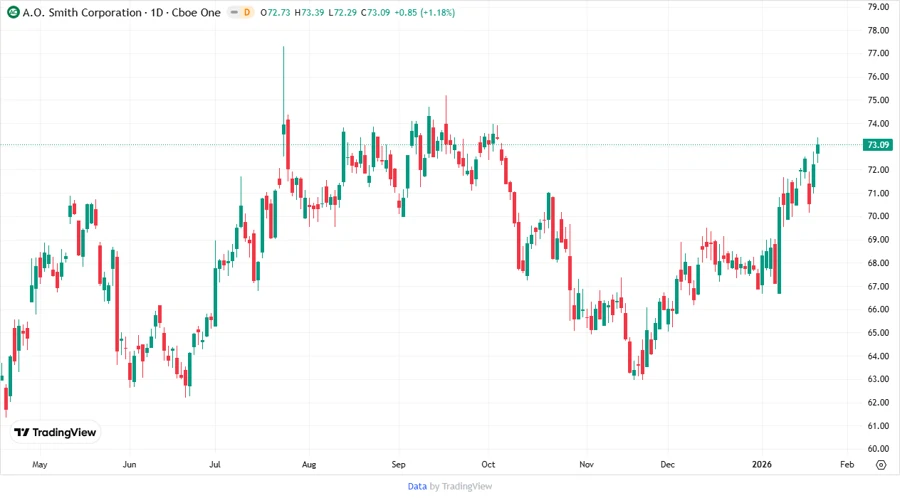
Price Development
Dividend Scoring System
🗣️This scoring system evaluates various attributes of A. O. Smith's dividend policy, providing an aggregate score to guide investment decisions.
| Category | Score | Score Bar |
|---|---|---|
| Dividend yield | 4 | |
| Dividend Stability | 5 | |
| Dividend growth | 4 | |
| Payout ratio | 4 | |
| Financial stability | 5 | |
| Dividend continuity | 5 | |
| Cashflow Coverage | 4 | |
| Balance Sheet Quality | 5 |
Overall Score: 36/40
Rating
🔍Based on our comprehensive analysis, A. O. Smith Corporation scores highly across key financial and dividend metrics, confirming its status as a reliable dividend payer. Its strong financials, consistent growth, and stable payout policies earn it a solid recommendation for income-focused investors.