October 22, 2025 a 02:47 am
AOS: Dividend Analysis - A. O. Smith Corporation
A. O. Smith Corporation has established itself as a reliable dividend payer with a history that spans over four decades. The company's consistent dividend growth combined with moderate payout ratios suggests a healthy financial stance to maintain and potentially increase its dividends further. This reliability makes A. O. Smith a compelling option for income-focused investors, provided the broader market challenges are navigated efficiently.
📊 Overview
The financial domain of A. O. Smith is notably robust, as mirrored in its sectoral presence and consistent dividend distribution over 41 years. Although the dividend yield is modest, a steady upward movement in dividend per share outlines its progressive financial health.
| Metric | Value |
|---|---|
| Sector | Industrials |
| Dividend yield | 1.94 % |
| Current dividend per share | 1.30 USD |
| Dividend history | 41 years |
| Last cut or suspension | 2013 |
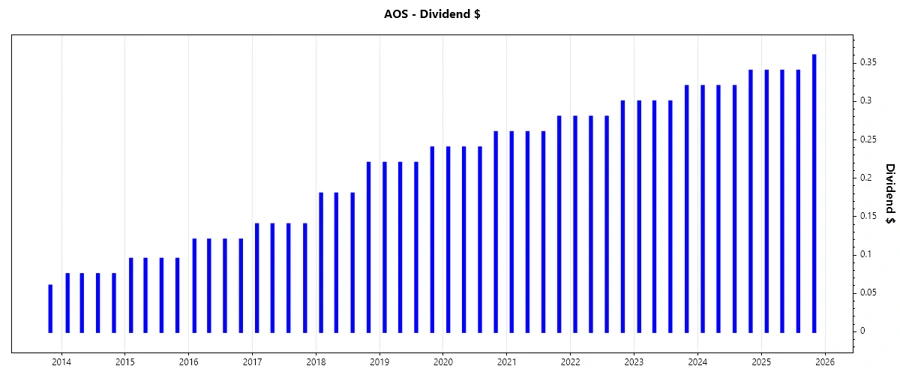
🗣️ Dividend History
The steadfast dividend history of A. O. Smith, with no cuts spanning over four decades, allows for predictable income streams, enhancing investor confidence. Despite market variances, their ability to sustain and gradually increase dividends underscores corporate resilience.
| Year | Dividend Per Share (USD) |
|---|---|
| 2025 | 1.38 |
| 2024 | 1.30 |
| 2023 | 1.22 |
| 2022 | 1.14 |
| 2021 | 1.06 |
📈 Dividend Growth
Dividend growth reflects the company's ability to increase payouts over time, suggesting successful revenue growth translating to shareholders. The calculations over three and five years demonstrate a disciplined financial practice focused on rewarding investors.
| Time | Growth |
|---|---|
| 3 years | 7.04 % |
| 5 years | 7.63 % |
The average dividend growth is 7.63 % over 5 years. This shows moderate but steady dividend growth.
📉 Payout Ratio
Payout ratios are crucial in assessing whether a company's dividend is sustainable. With both EPS and FCF ratios below 40%, A. O. Smith shows a conservative and stable approach, leaving room for ongoing dividend practices even amidst fluctuating earnings.
| Key figure | Ratio |
|---|---|
| EPS-based | 35.83 % |
| Free cash flow-based | 36.70 % |
Both the EPS-based (35.83 %) and FCF-based (36.70 %) ratios denote a sustainable payout level, balancing distribution and corporate growth needs.
✅ Cashflow & Capital Efficiency
Cash flow indicators and capital efficiency ratios reflect how well a company uses its resources to generate cash and value. A. O. Smith's financial mechanisms reveal robust cash flow generation capabilities and strategic capital allocations, underpinning dividend durability.
| Metric | 2024 | 2023 | 2022 |
|---|---|---|---|
| Free Cash Flow Yield | 4.73 % | 4.83 % | 3.62 % |
| Earnings Yield | 5.32 % | 4.50 % | 2.66 % |
| CAPEX to Operating Cash Flow | 18.56 % | 10.83 % | 17.96 % |
| Stock-based Compensation to Revenue | 0.39 % | 0.30 % | 0.30 % |
| Free Cash Flow / Operating Cash Flow Ratio | 81.44 % | 89.17 % | 82.04 % |
The strong cash flow yields and efficient use of operations for capital investments speak for robust cash management and investment practices, bolstering dividend continuity.
⚠️ Balance Sheet & Leverage Analysis
Evaluating balance sheet health and leverage helps determine financial resilience and ability to withstand economic challenges. A. O. Smith's metrics indicate low leverage and a strong liquidity position, which reduces financial risk.
| Metric | 2024 | 2023 | 2022 |
|---|---|---|---|
| Debt-to-Equity | 11.51 % | 8.41 % | 20.99 % |
| Debt-to-Assets | 6.69 % | 4.83 % | 11.01 % |
| Debt-to-Capital | 10.32 % | 7.76 % | 17.35 % |
| Net Debt to EBITDA | -0.03 | -0.22 | -0.08 |
| Current Ratio | — | — | 1.75 |
| Quick Ratio | 0.96 | 1.06 | 1.20 |
| Financial Leverage | 1.72 | 1.74 | 1.91 |
With low ratios across debts coupled with healthy liquidity positions, A. O. Smith demonstrates a commendable financial standing conducive to sustained operations and distributions.
✅ Fundamental Strength & Profitability
Examining profitability metrics emphasizes operational effectiveness and shareholder returns. A. O. Smith's consistently high return ratios illustrate not only strong earnings generation but also beneficial use of assets and equity.
| Metric | 2024 | 2023 | 2022 |
|---|---|---|---|
| Return on Equity | 28.33 % | 30.18 % | 13.49 % |
| Return on Assets | 16.47 % | 17.32 % | 7.07 % |
| Net Margin | 13.98 % | 14.45 % | 6.28 % |
| EBIT Margin | 18.54 % | 19.35 % | 6.21 % |
| EBITDA Margin | 20.60 % | 21.38 % | 8.26 % |
| Gross Margin | 38.14 % | 38.54 % | 35.42 % |
| R&D to Revenue | — | 2.53 % | 2.37 % |
The robust profit margins alongside high returns on equity and assets mirror corporate strength in transforming revenues into substantial margins, augmenting its attractive dividend policy.
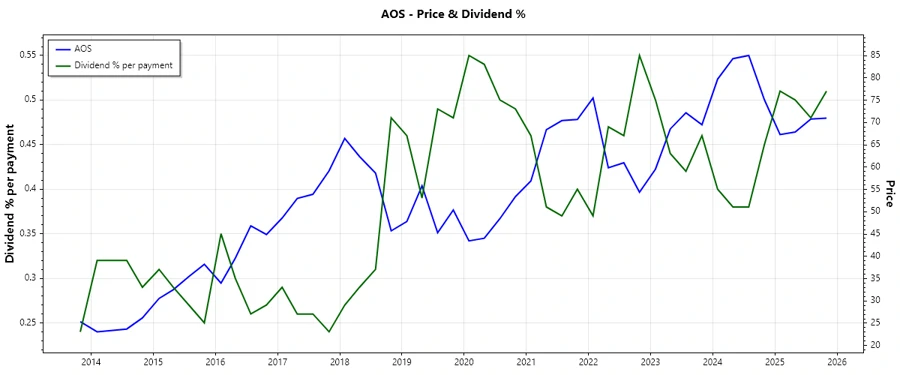
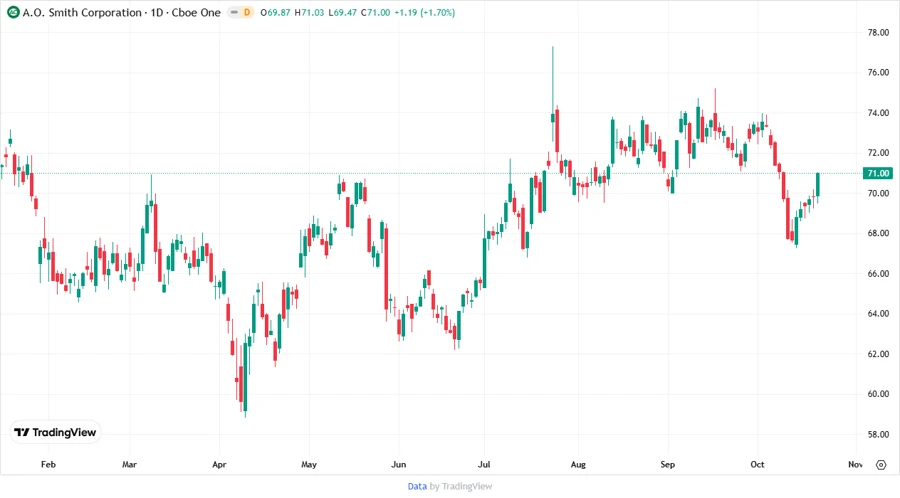
📈 Price Development
🗣️ Dividend Scoring System
| Criteria | Score | Score Bar |
|---|---|---|
| Dividend Yield | 3 | |
| Dividend Stability | 5 | |
| Dividend Growth | 3 | |
| Payout Ratio | 4 | |
| Financial Stability | 4 | |
| Dividend Continuity | 5 | |
| Cashflow Coverage | 4 | |
| Balance Sheet Quality | 4 |
Total Score: 32/40
✅ Rating
A. O. Smith Corporation demonstrates robust dividend stability and financial fundamentals, strategically complemented by a notable history of dividend increases. With efficient cash management practices and sustainable payout ratios, it is an appealing choice for income-oriented investors seeking stable returns amidst varying market conditions.
Smart Data Insight
Master the Perfect Entry & Exit for this Stock
Don't leave your profits to chance. Historically, this stock follows specific seasonal patterns that institutional traders use to maximize returns.
- ✅ Identify the "Golden Buying Window"
- ✅ Avoid high-risk correction cycles
- ✅ Backtested data from the last 20+ years