
July 12, 2026 a 11:43 am
AON: Fundamental Ratio Analysis - Aon plc
Aon plc, headquartered in Dublin, offers a range of insurance and consulting services globally. The company is known for its performance in risk management, human resources, and insurance solutions. Aon symbolizes stability and growth potential within the professional services industry.
Fundamental Rating
Aon's fundamental ratings indicate a strong performance in profitability and efficiency metrics. Based on the provided scores, Aon stands out in return on equity and assets.
| Category | Score | Visualization |
|---|---|---|
| Discounted Cash Flow | 4 | |
| Return On Equity | 5 | |
| Return On Assets | 5 | |
| Debt To Equity | 2 | |
| Price To Earnings | 2 | |
| Price To Book | 1 |
Historical Rating
Comparing historical data shows Aon's rating has been stable, suggesting consistent performance over time.
| Date | Overall | DCF | ROE | ROA | D/E | P/E | P/B |
|---|---|---|---|---|---|---|---|
| 2026-07-10 | 3 | 4 | 5 | 5 | 2 | 2 | 1 |
| Previous Date | 0 | 4 | 5 | 5 | 2 | 2 | 1 |
Analyst Price Targets
Analysts see Aon as a strong investment opportunity with solid future growth potential. The consensus aligns with a "Buy" rating.
| High | Low | Median | Consensus |
|---|---|---|---|
| $445 | $355 | $395.5 | $402.75 |
Analyst Sentiment
The analyst sentiment toward Aon is predominantly positive, supporting its solid market position with a majority leaning towards a "Buy" recommendation.
| Recommendation | Count | Visualization |
|---|---|---|
| Strong Buy | 0 | |
| Buy | 19 | |
| Hold | 18 | |
| Sell | 1 | |
| Strong Sell | 0 |
Conclusion
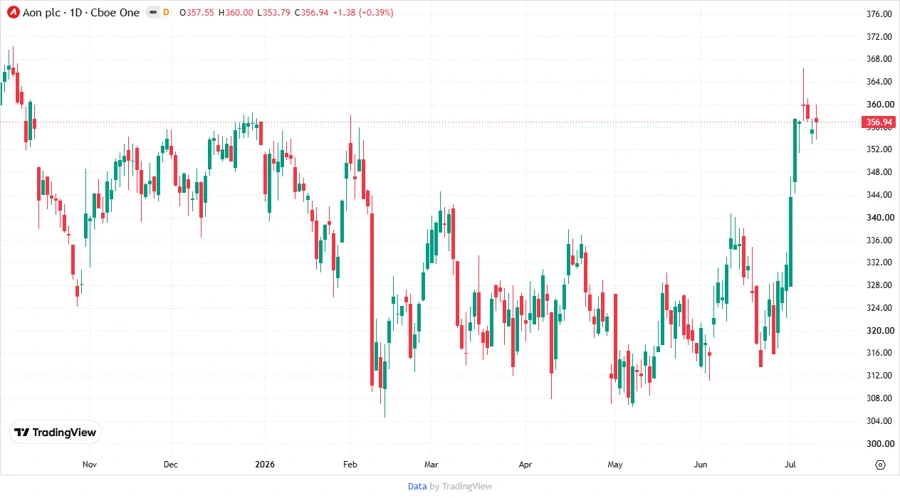
Aon plc presents a balanced investment with stable ratings in profitability and risk management. Despite some concerns over debt levels, its strengths in equity and asset returns make it appealing. The consensus among analysts suggests optimism, reflected in high price targets. However, investors should remain cautious of market fluctuations affecting the insurance sector. Overall, Aon positions itself as a robust choice for those seeking sustained growth with manageable risk.
Smart Data Insight
Master the Perfect Entry & Exit for this Stock
Don't leave your profits to chance. Historically, this stock follows specific seasonal patterns that institutional traders use to maximize returns.
- ✅ Identify the "Golden Buying Window"
- ✅ Avoid high-risk correction cycles
- ✅ Backtested data from the last 20+ years