October 29, 2025 a 05:15 am

AON: Fibonacci Analysis - Aon plc
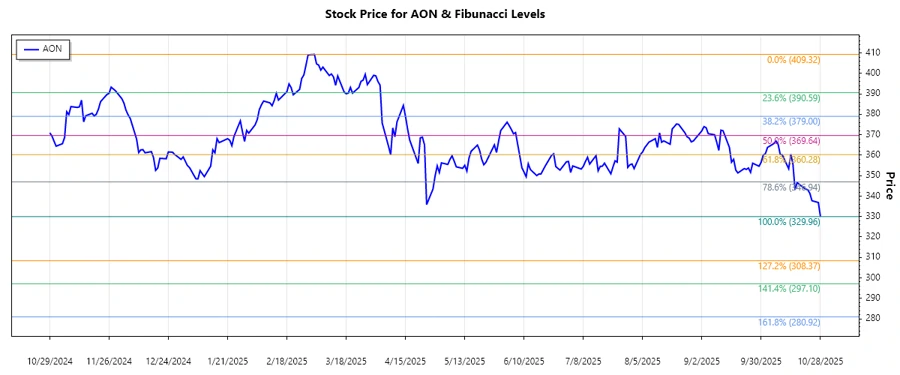
Aon plc has experienced a notable price decline over the past months, reflecting the broader market sentiments and potentially impacted by sector-specific challenges. Recent price movement indicates a potential opportunity for a technical rebound, aligning with identified retracement levels. Investors should keep an eye on potential strategic responses from Aon to mitigate risk and capitalize on market opportunities.
Fibonacci Analysis
| Aspect | Details |
|---|---|
| Trend | Downward |
| Start Date | 2025-03-03 |
| End Date | 2025-10-28 |
| High Point | $409.32 on 2025-03-03 |
| Low Point | $329.96 on 2025-10-28 |
| Fibonacci Level | Price Level ($) |
|---|---|
| 0.236 | 375.38 |
| 0.382 | 368.04 |
| 0.500 | 365.01 |
| 0.618 | 361.98 |
| 0.786 | 356.79 |
Current price is within the 0.618 retracement zone, suggesting strong potential support at this level.
This level can act as a significant support zone, indicating a good entry point for potential buyers as the stock may rebound.
Conclusion
Aon plc's stock has been on a decline, with a significant drop from its highs earlier in the year. The identified support at the 0.618 Fibonacci level indicates a potential halting point for this decline, providing a possible entry point for investors. However, external market conditions and Aon's own strategic initiatives will play a vital role in determining the stock's future performance. Analysts should consider the company's adaptability to market conditions and potential for growth when assessing its investment potential.
Smart Data Insight
Master the Perfect Entry & Exit for this Stock
Don't leave your profits to chance. Historically, this stock follows specific seasonal patterns that institutional traders use to maximize returns.
- ✅ Identify the "Golden Buying Window"
- ✅ Avoid high-risk correction cycles
- ✅ Backtested data from the last 20+ years