October 26, 2025 a 11:44 am
AON: Fibunacci Analysis - Aon plc
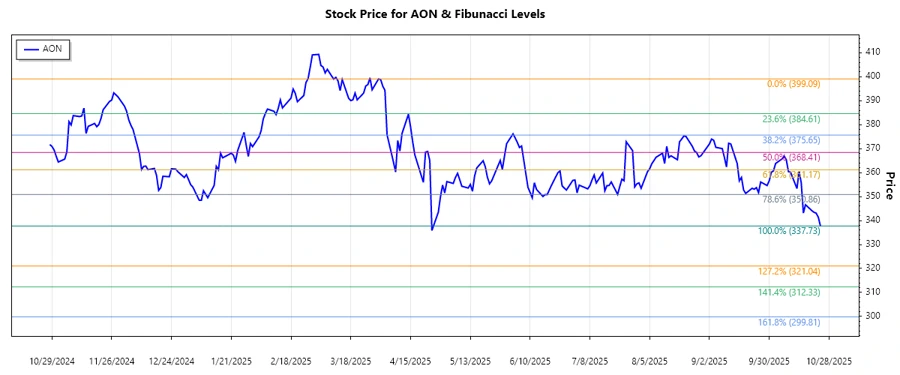
Aon plc has exhibited some interesting price movements over the last few months. Recently, the stock has shown signs of a dominant downtrend from April 2025 to October 2025. Given the company's broad portfolio in risk management and corporate finance advisory, investors should consider the potential for support at the identified Fibonacci levels.
Fibonacci Analysis
| Parameter | Details |
|---|---|
| Trend Period Start | 2025-04-01 |
| Trend Period End | 2025-10-24 |
| High Point | 399.09 on 2025-03-31 |
| Low Point | 337.73 on 2025-10-24 |
| Fibonacci Level | Price Level |
|---|---|
| 0.236 | 351.71 |
| 0.382 | 361.18 |
| 0.5 | 368.41 |
| 0.618 | 375.64 |
| 0.786 | 387.45 |
The current price of AON is at 337.73, indicating that it is not within any retracement zones. This suggests potential further decreases until support is found.
Technical interpretation suggests monitoring the price levels at these Fibonacci retracement points, as they could act as potential support or resistance levels.
Conclusion
Aon plc's stock is navigating a downward trend, offering potential buying opportunities if support is established at the Fibonacci levels identified. While the technicals suggest continuation to lower levels, it's crucial to consider macroeconomic factors and company performance. Traders should remain cautious and watch these levels for any significant changes in market sentiment. As global services and demand fluctuate, Aon plc might still provide a long-term assurance due to its diverse operations. However, near-term risks persist.
Smart Data Insight
Master the Perfect Entry & Exit for this Stock
Don't leave your profits to chance. Historically, this stock follows specific seasonal patterns that institutional traders use to maximize returns.
- ✅ Identify the "Golden Buying Window"
- ✅ Avoid high-risk correction cycles
- ✅ Backtested data from the last 20+ years