
September 26, 2025 a 06:45 am
AON: Fibonacci Analysis - Aon plc
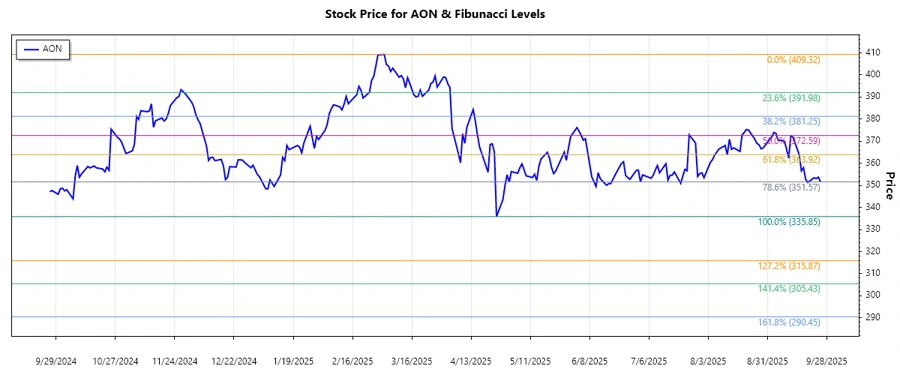
The stock of Aon plc, with its foundation as a professional services firm, is influenced by the global risk and consulting market. Recently, the stock has shown variability but maintains resilience due to its diversified services in risk, retirement, and health. Aon's strategic acquisitions and extensive client base continue to bolster its market presence, contributing to its steady growth.
Fibonacci Analysis
| Description | Details |
|---|---|
| Trend Start Date | 2024-12-31 |
| Trend End Date | 2025-09-25 |
| High Point | $409.32 on 2025-02-28 |
| Low Point | $335.85 on 2025-04-25 |
Calculated Fibonacci Levels:
| Level | Price |
|---|---|
| 0.236 | $356.12 |
| 0.382 | $366.32 |
| 0.5 | $372.58 |
| 0.618 | $378.83 |
| 0.786 | $387.67 |
Current Price is at $351.64, falling below the 0.236 Fibonacci level, indicating no retracement currently.
Technical Interpretation: The recent downtrend has pushed the stock below critical retracement levels, suggesting strong resistance ahead at $366.32 and possible support near the lower Fibonacci levels if downward pressure continues.
Conclusion
The current analysis indicates that Aon plc has faced a significant downtrend, breaking below crucial Fibonacci levels. While the firm's comprehensive services offer growth opportunities, market conditions and economic factors create potential volatility. Analysts must consider both the robust business model and external market forces in evaluating future movements. Continued monitoring of key support and resistance levels will be essential, as breaking significant resistance could signal a potential recovery or further decline if lower levels are tested.
Smart Data Insight
Master the Perfect Entry & Exit for this Stock
Don't leave your profits to chance. Historically, this stock follows specific seasonal patterns that institutional traders use to maximize returns.
- ✅ Identify the "Golden Buying Window"
- ✅ Avoid high-risk correction cycles
- ✅ Backtested data from the last 20+ years