
June 04, 2026 a 03:31 pm

AON: Dividend Analysis - Aon plc
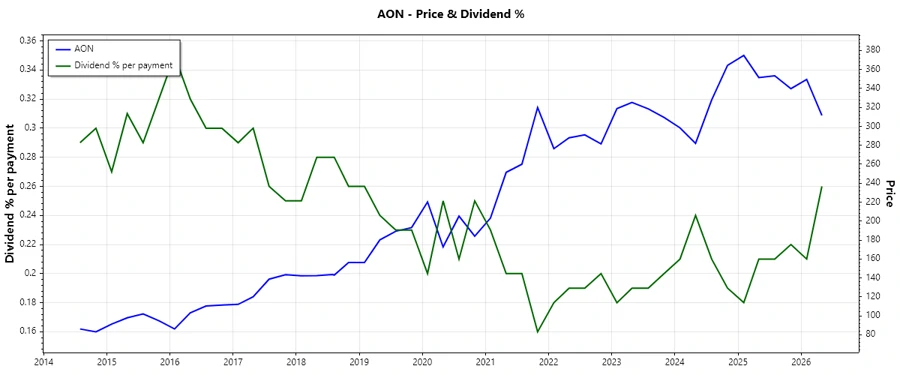
Aon plc exhibits a robust dividend profile with a reliable 44-year history of dividend payments. With its modest dividend yield of 0.98% and a five-year dividend growth rate of 10.33%, Aon plc demonstrates a commitment to rewarding shareholders consistently. This highlights the company's financial health and its focus on sustaining and growing dividends over the long term.
📊 Overview
Aon plc operates in the professional services sector, focusing on risks, retirement, and health solutions. The company has a promising dividend yield of 0.98% and a prudent approach with no recent cuts or suspensions in its dividends.
| Metric | Value |
|---|---|
| Sector | Professional Services |
| Dividend Yield | 0.98% |
| Current Dividend per Share | 2.92 USD |
| Dividend History | 44 years |
| Last Cut or Suspension | None |
🗣️ Dividend History
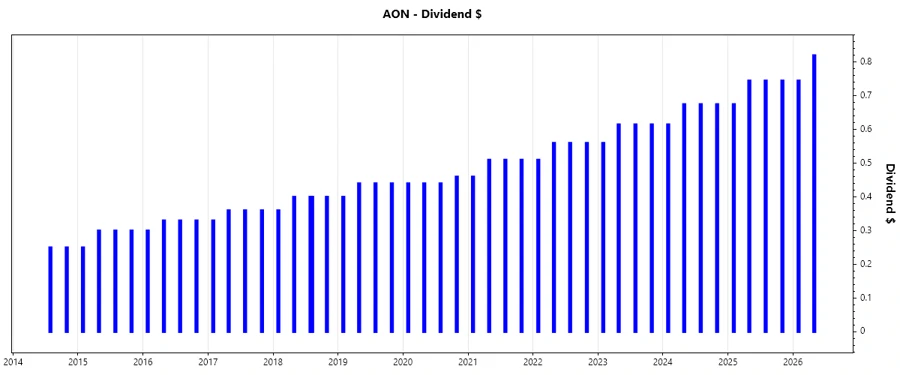
The strength of Aon plc's dividend history underscores its commitment to returning value to shareholders. A continuous and increasing dividend payment signals management's confidence in future cash flows and financial stability.
| Year | Dividend per Share (USD) |
|---|---|
| 2026 | 1.565 |
| 2025 | 2.910 |
| 2024 | 2.640 |
| 2023 | 2.405 |
| 2022 | 2.19 |
📈 Dividend Growth
The analysis of Aon plc's dividend growth metrics reveals a vivid history of increasing shareholder returns. This growth is crucial for maintaining the purchasing power of dividends paid to investors over time.
| Time | Growth |
|---|---|
| 3 years | 9.94% |
| 5 years | 10.33% |
The average dividend growth is 10.33% over 5 years. This shows moderate but steady dividend growth, reinforcing Aon plc's strategy to enhance shareholder wealth.
Payout Ratio
Understanding the payout ratios of a company provides insight into how much profit is being returned to shareholders in the form of dividends. Aon plc maintains disciplined payout ratios, ensuring sustainability and the ability to reinvest in growth opportunities.
| Key Figure | Ratio |
|---|---|
| EPS-based | 15.90% |
| Free Cash Flow-based | 17.86% |
The company's EPS within their payout ratio of 15.90% and its free cash flow payout ratio of 17.86% show a conservative approach ensuring dividend sustainability without straining financial resources.
Cashflow & Capital Efficiency
Analyzing cashflow and capital efficiency gives a overview of the company's ability to generate cash over and above its investments. This infers financial flexibility and potentially higher future payouts.
| Metric | 2025 | 2024 | 2023 |
|---|---|---|---|
| Free Cash Flow Yield | 4.24% | 3.71% | 5.37% |
| Earnings Yield | 4.87% | 3.49% | 4.33% |
| CAPEX to Operating Cash Flow | 7.27% | 7.18% | 7.34% |
| Stock-based Compensation to Revenue | 3.02% | 3.27% | |
| Free Cash Flow / Operating Cash Flow Ratio | 92.44% | 92.81% | 92.66% |
The overall cash flow and capital efficiency metrics suggest that Aon plc efficiently manages its capital investments and continues to maintain a healthy cash flow generation ability.
Balance Sheet & Leverage Analysis
A healthy balance sheet with manageable leverage ratios is vital for long-term financial strength and stability of any company. Aon plc appears to manage its debt and assets prudently, ensuring operational flexibility.
| Metric | 2025 | 2024 | 2023 |
|---|---|---|---|
| Debt-to-Equity | 1.77 | 2.92 | -14.57 |
| Debt-to-Assets | 32.55% | 36.54% | 35.43% |
| Debt-to-Capital | 63.87% | 74.51% | 107.37% |
| Net Debt to EBITDA | 2.09 | 3.40 | 2.88 |
| Current Ratio | 1.07 | 1.02 | 1.00 |
| Quick Ratio | 1.11 | 1.02 | 1.00 |
| Financial Leverage | 5.43 | 8.00 | -41.11 |
Aon plc's balance sheet and leverage analysis lend confidence in their strategic debt management and liquidity maintenance, amidst fluctuating financial leverage.
Fundamental Strength & Profitability
By evaluating Aon plc's profitability ratios and margins, stakeholders can infer the company's ability to generate profits relative to revenue, equity, and other financial metrics.
| Metric | 2025 | 2024 | 2023 |
|---|---|---|---|
| Return on Equity | 39.51% | 43.36% | -3.104% |
| Return on Assets | 7.28% | 5.42% | 7.55% |
| Return on Invested Capital | 12.16% | 11.20% | 22.92% |
| Net Profit Margin | 21.51% | 16.91% | 19.17% |
| EBIT Margin | 25.50% | 27.07% | 27.31% |
| EBITDA Margin | 31.13% | 31.44% | 29.22% |
| Gross Margin | 47.70% | 47.24% | 48.40% |
| R&D to Revenue | 0% | 0% | 0% |
Aon plc exhibits strong profitability metrics, yet there's a negative return on equity for 2023, indicating exceptional financial elements influencing that year.
📉 Price Development
✅ Dividend Scoring System
| Category | Score | Graph |
|---|---|---|
| Dividend Yield | 3 | |
| Dividend Stability | 5 | |
| Dividend Growth | 4 | |
| Payout Ratio | 4 | |
| Financial Stability | 3 | |
| Dividend Continuity | 5 | |
| Cashflow Coverage | 4 | |
| Balance Sheet Quality | 3 |
Total Score: 31/40
🔍 Rating
Aon plc demonstrates a commendable commitment to consistent dividend payments, underscoring a solid financial foundation with room for moderate dividend growth. Despite a modest yield, its strong dividend history complements its financial strategies. Investors seeking steady income along with potential medium-term appreciation may consider Aon plc. The overall assessment supports an actionable 'Hold' for prudent dividend-focused portfolios.
Smart Data Insight
Master the Perfect Entry & Exit for this Stock
Don't leave your profits to chance. Historically, this stock follows specific seasonal patterns that institutional traders use to maximize returns.
- ✅ Identify the "Golden Buying Window"
- ✅ Avoid high-risk correction cycles
- ✅ Backtested data from the last 20+ years