May 15, 2026 a 07:46 am

AON: Dividend Analysis - Aon plc
Aon plc has demonstrated a consistent commitment to rewarding its shareholders through dividends. With a market capitalization of approximately $67 billion, Aon displays a stable dividend yield, supported by robust financials and a long-standing history of dividend payments. As one of the industry leaders in financial services, Aon's dividend policy reflects a strong fiscal health, promising sustainability and growth in shareholder returns.
Overview 📊
The overview of Aon plc's dividend profile reflects its stable and consistent approach to shareholder returns. The company, operating within the financial sector, boasts a solid 44-year track record of dividend history, emphasizing its commitment to investors. Despite a relatively modest dividend yield of about 0.98%, the company's consistency and growth potential are noteworthy.
| Sector | Dividend Yield (%) | Current Dividend per Share (USD) | Dividend History (Years) | Last Cut or Suspension |
|---|---|---|---|---|
| Financial Services | 0.98 | 2.92 | 44 | None |
Dividend History 📈
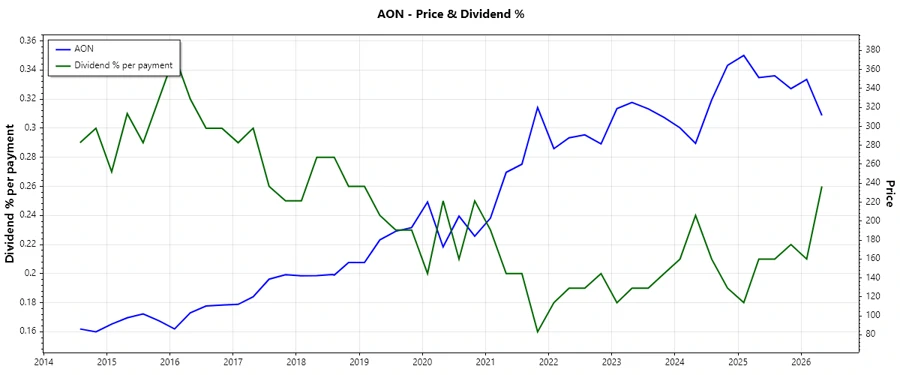
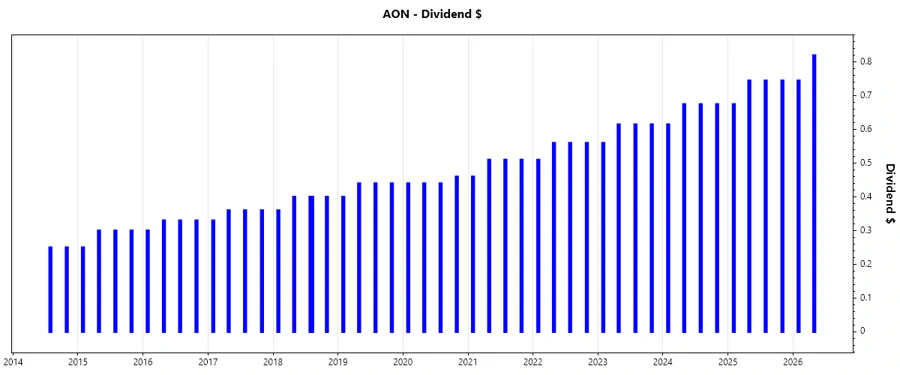
Understanding Aon plc's dividend history is crucial for evaluating its performance and sustainability. The company's long-standing history of 44 years without a cut underscores its commitment to shareholder returns. This track record is indicative of resilience and financial discipline, particularly vital in the cyclical financial services sector.
| Year | Dividend per Share (USD) |
|---|---|
| 2026 | 1.565 |
| 2025 | 2.910 |
| 2024 | 2.640 |
| 2023 | 2.405 |
| 2022 | 2.19 |
Dividend Growth 📉
Assessment of Aon's dividend growth is critical to understanding future potential. Aon's 5-year average dividend growth rate of 10.33% suggests a firm stance on enhancing shareholder value. This consistent growth trajectory is particularly impressive, highlighting the company's ability to scale dividends alongside earnings growth.
| Time | Growth (%) |
|---|---|
| 3 years | 9.94 |
| 5 years | 10.33 |
The average dividend growth is 10.33% over 5 years. This shows moderate but steady dividend growth.
Payout Ratio 🗣️
The payout ratios offer insights into Aon's dividend sustainability. With an EPS-based payout ratio of 15.90% and a free cash flow-based payout ratio of 17.86%, Aon maintains conservative payout levels. This low payout ratio suggests significant capacity for future growth and indicates prudent financial management.
| Key figure | Ratio (%) |
|---|---|
| EPS-based | 15.90 |
| Free cash flow-based | 17.86 |
Aon's low payout ratios signify a robust potential for dividend continuity and growth, aligning well with the company's strategic financial objectives.
Cashflow & Capital Efficiency ✅
Evaluating the cash flow stability and capital efficiency of Aon provides deeper insights into operational performance. These metrics emphasize efficient capital allocation and strong cash flow generation, both vital for sustaining dividends and funding growth initiatives.
| Year | 2025 | 2024 | 2023 |
|---|---|---|---|
| Free Cash Flow Yield | 4.24% | 3.71% | 5.37% |
| Earnings Yield | 4.87% | 3.50% | 4.33% |
| CAPEX to Operating Cash Flow | 7.27% | 7.18% | 7.34% |
| Stock-based Compensation to Revenue | 0% | 3.02% | 3.27% |
| Free Cash Flow / Operating Cash Flow Ratio | 92.44% | 92.81% | 92.66% |
Aon exhibits strong cash flow generation with stable yields and efficient capital allocation, supporting both operational stability and future dividend increases.
Balance Sheet & Leverage Analysis ⚠️
Analysis of Aon's balance sheet and leverage ratios provides key insights into its financial health and debt management. Aon's stable leverage metrics and favorable debt ratios emphasize prudent financial strategies that mitigate risks associated with debt.
| Year | 2025 | 2024 | 2023 |
|---|---|---|---|
| Debt-to-Equity | 176.76% | 292.31% | -1456.65% |
| Debt-to-Assets | 32.55% | 36.54% | 35.43% |
| Debt-to-Capital | 63.87% | 74.51% | 107.37% |
| Net Debt to EBITDA | 2.87 | 3.40 | 2.88 |
| Current Ratio | 1.11 | 1.02 | 1.00 |
| Quick Ratio | 1.11 | 1.02 | 1.00 |
| Financial Leverage | 543.03% | 799.95% | -4111.26% |
Aon's leverage ratios, particularly in 2023, indicate potential restructuring or extraordinary circumstances. The company's ability to manage its leverage effectively remains crucial for its long-term financial stability.
Fundamental Strength & Profitability 📉
The fundamental metrics of Aon shed light on its efficiency and profit-generating capabilities. High return on equity and asset figures underscore management's competence in exploiting assets and equity for value creation.
| Year | 2025 | 2024 | 2023 |
|---|---|---|---|
| Return on Equity | 39.51% | 43.36% | -310.41% |
| Return on Assets | 7.28% | 5.42% | 7.55% |
| Margins: Net | 21.51% | 16.91% | 19.17% |
| Margins: EBIT | 25.51% | 27.07% | 27.31% |
| Margins: EBITDA | 31.13% | 31.44% | 29.22% |
| Margins: Gross | 47.70% | 47.24% | 48.40% |
| Research & Development to Revenue | 0% | 0% | 0% |
Despite a negative return on equity in 2023, the company maintains strong profitability margins, indicating ongoing operational efficiency and value creation potential.
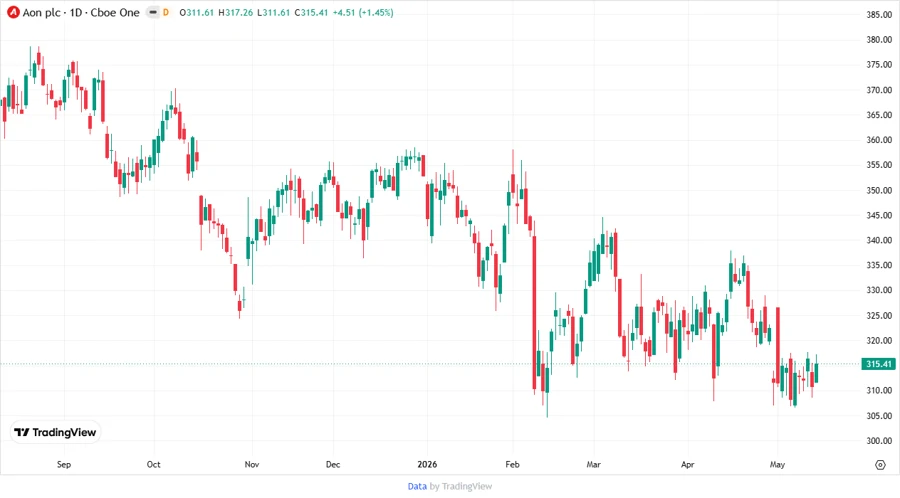
Price Development 📈
Dividend Scoring System ⚖️
| Category | Score (1-5) | Score Bar |
|---|---|---|
| Dividend yield | 3 | |
| Dividend Stability | 5 | |
| Dividend growth | 4 | |
| Payout ratio | 5 | |
| Financial stability | 4 | |
| Dividend continuity | 5 | |
| Cashflow Coverage | 4 | |
| Balance Sheet Quality | 3 |
Overall Score: 33/40
Rating ⭐
Based on Aon's strong dividend history, robust financial management, and potential for growth, the company is rated highly for dividend investors seeking stability and modest growth. The combination of steady payout, solid financial backbone, and seasoned dividend strategy makes Aon a worthwhile consideration for investors prioritizing income reliability and sustainability.
Smart Data Insight
Master the Perfect Entry & Exit for this Stock
Don't leave your profits to chance. Historically, this stock follows specific seasonal patterns that institutional traders use to maximize returns.
- ✅ Identify the "Golden Buying Window"
- ✅ Avoid high-risk correction cycles
- ✅ Backtested data from the last 20+ years