June 13, 2026 a 03:15 am

ANET: Trend and Support & Resistance Analysis - Arista Networks, Inc.
Arista Networks, Inc. operates in a dynamic and competitive cloud networking solutions market. With its innovative approach and comprehensive product portfolio, the company addresses various sectors, promising robust growth potential. The company's stocks reflect these opportunities amidst market challenges, showing a recent trend shift that may interest both short-term traders and long-term investors.
Trend Analysis
| Date | Closing Price | Trend |
|---|---|---|
| 2026-06-12 | 163.24 | ▲ |
| 2026-06-11 | 156.4 | ▼ |
| 2026-06-10 | 151.76 | ▼ |
| 2026-06-09 | 152.16 | ▲ |
| 2026-06-08 | 156.4 | ▲ |
| 2026-06-05 | 154.27 | ▼ |
| 2026-06-04 | 166.01 | ▲ |
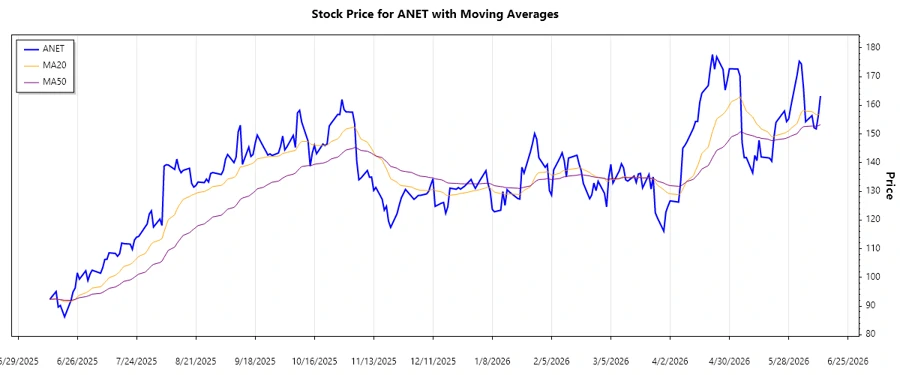
The stock has shown volatility with alternating up and down days. Based on EMA calculations, the EMA20 is 157.05 and EMA50 is 145.92, signaling a ▲ bullish trend. It indicates a potential upside momentum that may interest traders.
Support and Resistance
| Zone | From | To |
|---|---|---|
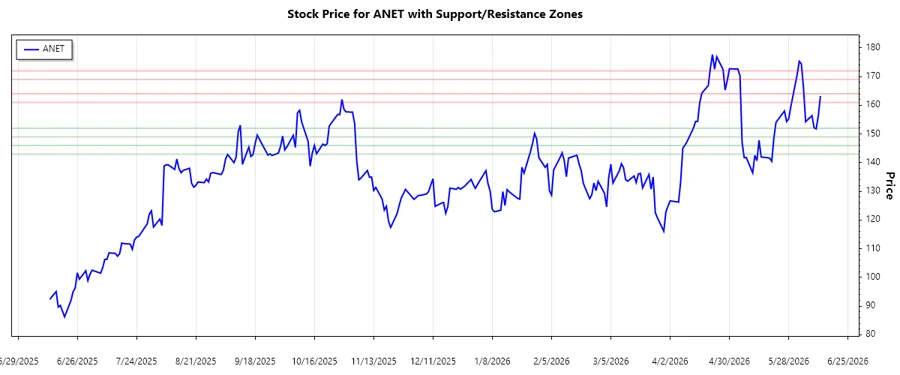
| Resistance 1 | 161.00 | 164.00 |
| Resistance 2 | 169.00 | 172.00 |
| Support 1 | 143.00 | 146.00 |
| Support 2 | 149.00 | 152.00 |
Currently, the stock is trading within the upper resistance zone, suggesting potential profit-taking scenarios but also opportunities for a breakout. Investors should monitor the stock closely for confirmation of any trend continuation or reversal.
Conclusion
The technical analysis of Arista Networks, Inc. indicates a current bullish trend with the stock trading within its upper resistance range. This positioning suggests increased attention from traders looking for a breakout or reversal opportunities. On the other hand, downside risks remain, particularly if the broader market conditions shift adversely. Fundamental strengths and market positioning of Arista provide optimism, but vigilance against volatility is recommended. Overall, the balance of opportunities and risks highlights its dynamic market environment.
Smart Data Insight
Master the Perfect Entry & Exit for this Stock
Don't leave your profits to chance. Historically, this stock follows specific seasonal patterns that institutional traders use to maximize returns.
- ✅ Identify the "Golden Buying Window"
- ✅ Avoid high-risk correction cycles
- ✅ Backtested data from the last 20+ years