
July 25, 2025 a 04:44 pm
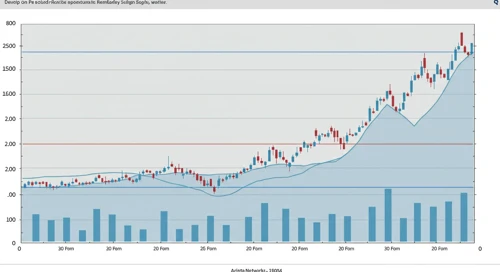

ANET: Fibonacci Analysis - Arista Networks, Inc.
Arista Networks, Inc. shows remarkable resilience in the volatile tech sector due to its robust cloud networking solutions. Despite industry challenges, the company has capitalized on the increasing demand for data-driven solutions, which is reflected in its stock performance. Investors should note the potential for growth given Arista's strategic expansions in emerging markets. Nevertheless, it's critical to stay cautious of potential market corrections.
Fibonacci Analysis
| Parameter | Details |
|---|---|
| Start Date | 2025-03-25 |
| End Date | 2025-07-25 |
| High Price & Date | $114.9204 on 2025-07-25 |
| Low Price & Date | $86.25 on 2025-06-20 |
| 0.236 Level | $93.54 |
| 0.382 Level | $98.60 |
| 0.5 Level | $100.5852 |
| 0.618 Level | $104.65 |
| 0.786 Level | $110.26 |
| Current Price | $114.9204 |
| Retracement Zone | Beyond 0.786 |
| Technical Interpretation | The current stock price indicates a strong bullish trend surpassing the key Fibonacci levels, suggesting strong momentum and possible resistance around $120. |
Conclusion
The technical analysis for Arista Networks, Inc. reveals a promising uptrend, powered by robust financial and strategic growth. The stock has already exceeded major Fibonacci retracement levels, suggesting a strong bullish impulse. However, as the price approaches potential resistance near previous high levels, investors should remain vigilant for any indications of a retracement. Overall, Arista's strong market position and continuous innovation provide a favorable outlook, yet market volatility is a risk factor that must be monitored. The existing economic scenarios and sector trends imply possible corrections, which may present new entry points for strategic investors.
Smart Data Insight
Master the Perfect Entry & Exit for this Stock
Don't leave your profits to chance. Historically, this stock follows specific seasonal patterns that institutional traders use to maximize returns.
- ✅ Identify the "Golden Buying Window"
- ✅ Avoid high-risk correction cycles
- ✅ Backtested data from the last 20+ years