
June 24, 2026 a 04:03 am
AMZN: Trend and Support & Resistance Analysis - Amazon.com, Inc.
Amazon.com, Inc. (AMZN), with its expansive presence in e-commerce and cloud computing, remains a pivotal entity in the global market space. Recent technical analysis of AMZN suggests a period of volatility, with trends showing signs of potential bearish movements in the short to mid-term. Investment risks are present, yet opportunities arise with strategic entry and exit decisions based on the identified support and resistance levels. Overall, AMZN continues to be influenced by broader market dynamics and sector-specific developments, especially within its AWS segment.
Trend Analysis
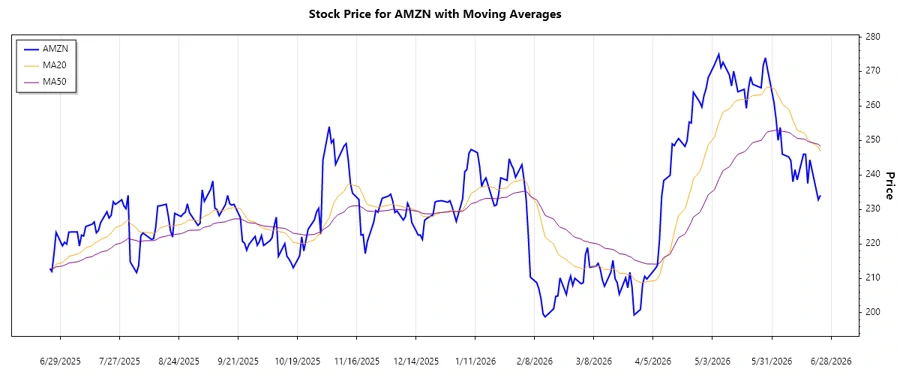
This analysis covers the recent data-driven trends observed in AMZN's stock performance. Using the EMA20 and EMA50 indicators, we assess the trend direction.
| Date | Close Price | Trend |
|---|---|---|
| 2026-06-23 | 234.11 | ▼ |
| 2026-06-22 | 232.79 | ▼ |
| 2026-06-18 | 244.39 | ▼ |
| 2026-06-17 | 237.50 | ▼ |
| 2026-06-16 | 246.00 | ▼ |
| 2026-06-15 | 246.02 | ▼ |
| 2026-06-12 | 238.55 | ▼ |
The data shows a dominant ▼ downtrend as EMA20 is less than EMA50, indicating potential further declines. Investors might consider caution due to bearish market signals.
Support and Resistance
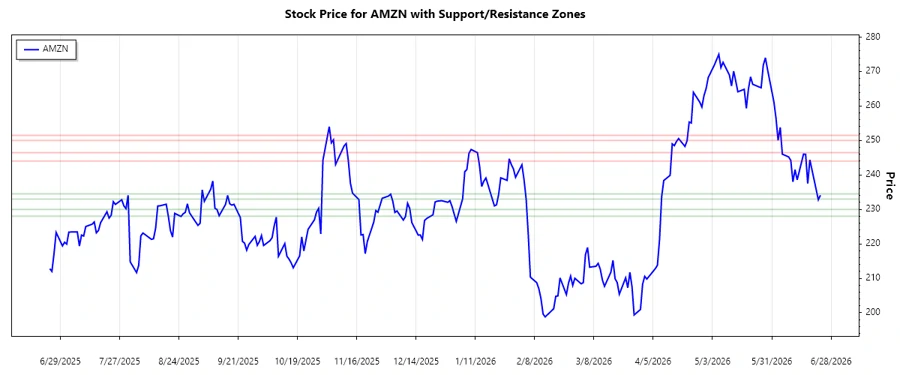
Identifying critical support and resistance levels can offer insights into potential reversal points for AMZN.
| Support Level | Resistance Level |
|---|---|
| 233.00 - 234.50 | 244.00 - 246.50 |
| 228.00 - 230.00 | 250.00 - 251.50 |
The current stock price hovers near the first support zone, indicating possible resilience against further decreases. Should it break below, the next support level becomes critical in preventing additional losses.
Conclusion
Amazon's stock exhibits a predominantly bearish trend, with EMA signals confirming downward movement. Risk-averse investors might seek confirmation before taking positions, while those with a higher risk tolerance might see potential in shorting opportunities. Key support and resistance levels will play a crucial role in future price movements, requiring close monitoring. Overall, market volatility emphasizes the need for careful and data-driven strategy formulation, particularly in light of AMZN's influence in retail and cloud computing sectors.
Smart Data Insight
Master the Perfect Entry & Exit for this Stock
Don't leave your profits to chance. Historically, this stock follows specific seasonal patterns that institutional traders use to maximize returns.
- ✅ Identify the "Golden Buying Window"
- ✅ Avoid high-risk correction cycles
- ✅ Backtested data from the last 20+ years