January 14, 2026 a 04:03 am


AMZN: Trend and Support & Resistance Analysis - Amazon.com, Inc.
Amazon.com, Inc. operates in a diverse set of segments, including retail, technology, and digital content. Recent trends suggest a dynamic market for the company, influenced by consumer demand, technological innovations, and global economic conditions. As analysts focus on this data, the importance of identifying trends and strategic financial zones becomes apparent.
Trend Analysis
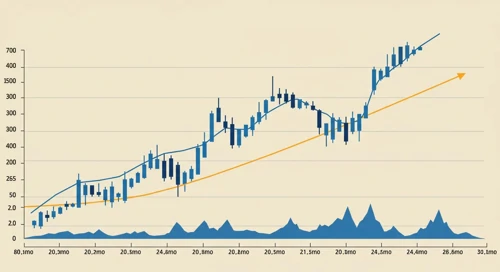
The analysis of the historical data using Exponential Moving Averages (EMA) indicates a dominant trend direction. By calculating the EMA20 and EMA50, the trend direction becomes clearer:
| Date | Close Price | Trend |
|---|---|---|
| 2026-01-13 | $242.60 | ▲ Upward |
| 2026-01-12 | $246.47 | ▲ Upward |
| 2026-01-09 | $247.38 | ▲ Upward |
| 2026-01-08 | $246.29 | ⚖️ Neutral |
| 2026-01-07 | $241.56 | ▼ Downward |
| 2026-01-06 | $240.93 | ▼ Downward |
| 2026-01-05 | $233.06 | ▼ Downward |
Overall, the trend analysis indicates a mixed pattern with fluctuating trends, thus requiring careful consideration for future predictions.
Support and Resistance
Based on the recent price patterns, the following support and resistance zones have been identified:
| Zone Type | From Price | To Price | |
|---|---|---|---|
| Support Zone 1 | $225.00 | $230.00 | ▼ Weakening |
| Support Zone 2 | $215.00 | $220.00 | ▲ Strengthening |
| Resistance Zone 1 | $245.00 | $250.00 | ▲ Strengthening |
| Resistance Zone 2 | $235.00 | $240.00 | ▼ Weakening |
Currently, the price is close to a strong resistance zone, suggesting potential testing of this level in upcoming sessions.
Conclusion
The recent analysis of Amazon stocks shows a volatile market environment that requires active monitoring. The combination of near resistance levels and a mixed trend direction brings both opportunities and risks for traders and investors. A close watch on macroeconomic factors and company-specific news is crucial to navigate future price movements successfully. Overall, strategic investments in Amazon would benefit from an informed approach, blending technical with fundamental analysis.